 PBIX (Power BI)
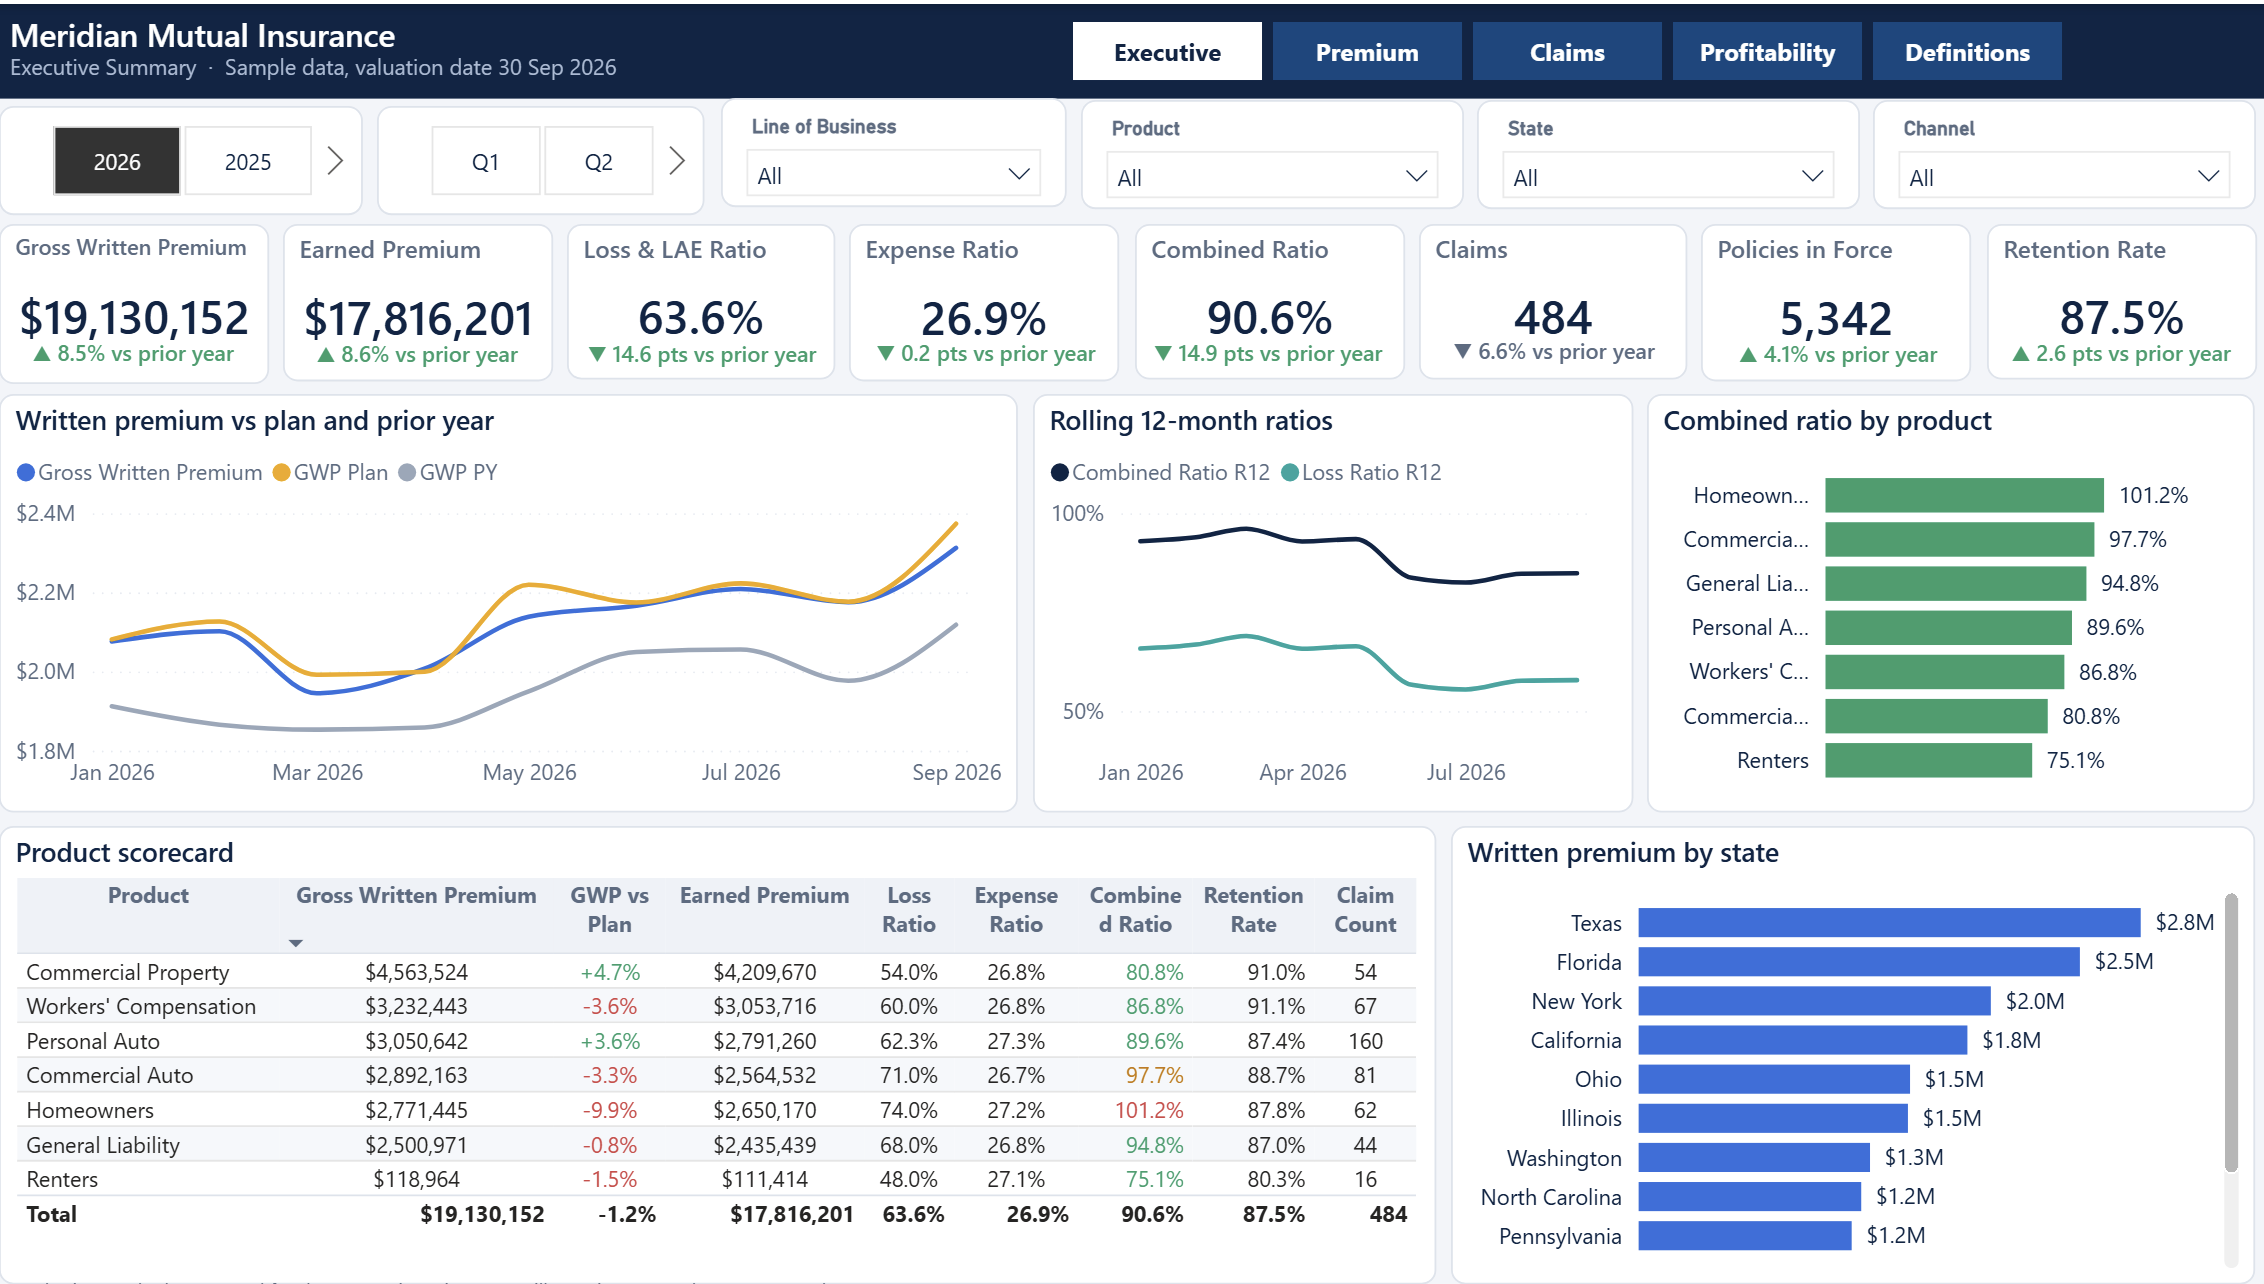
Insurance Analytics Dashboard
A Power BI insurance analytics dashboard covering premiums, claims, loss ratio, profitability, retention and agency performance. Includes five report pages and 120+ DAX measures.
View Dashboard →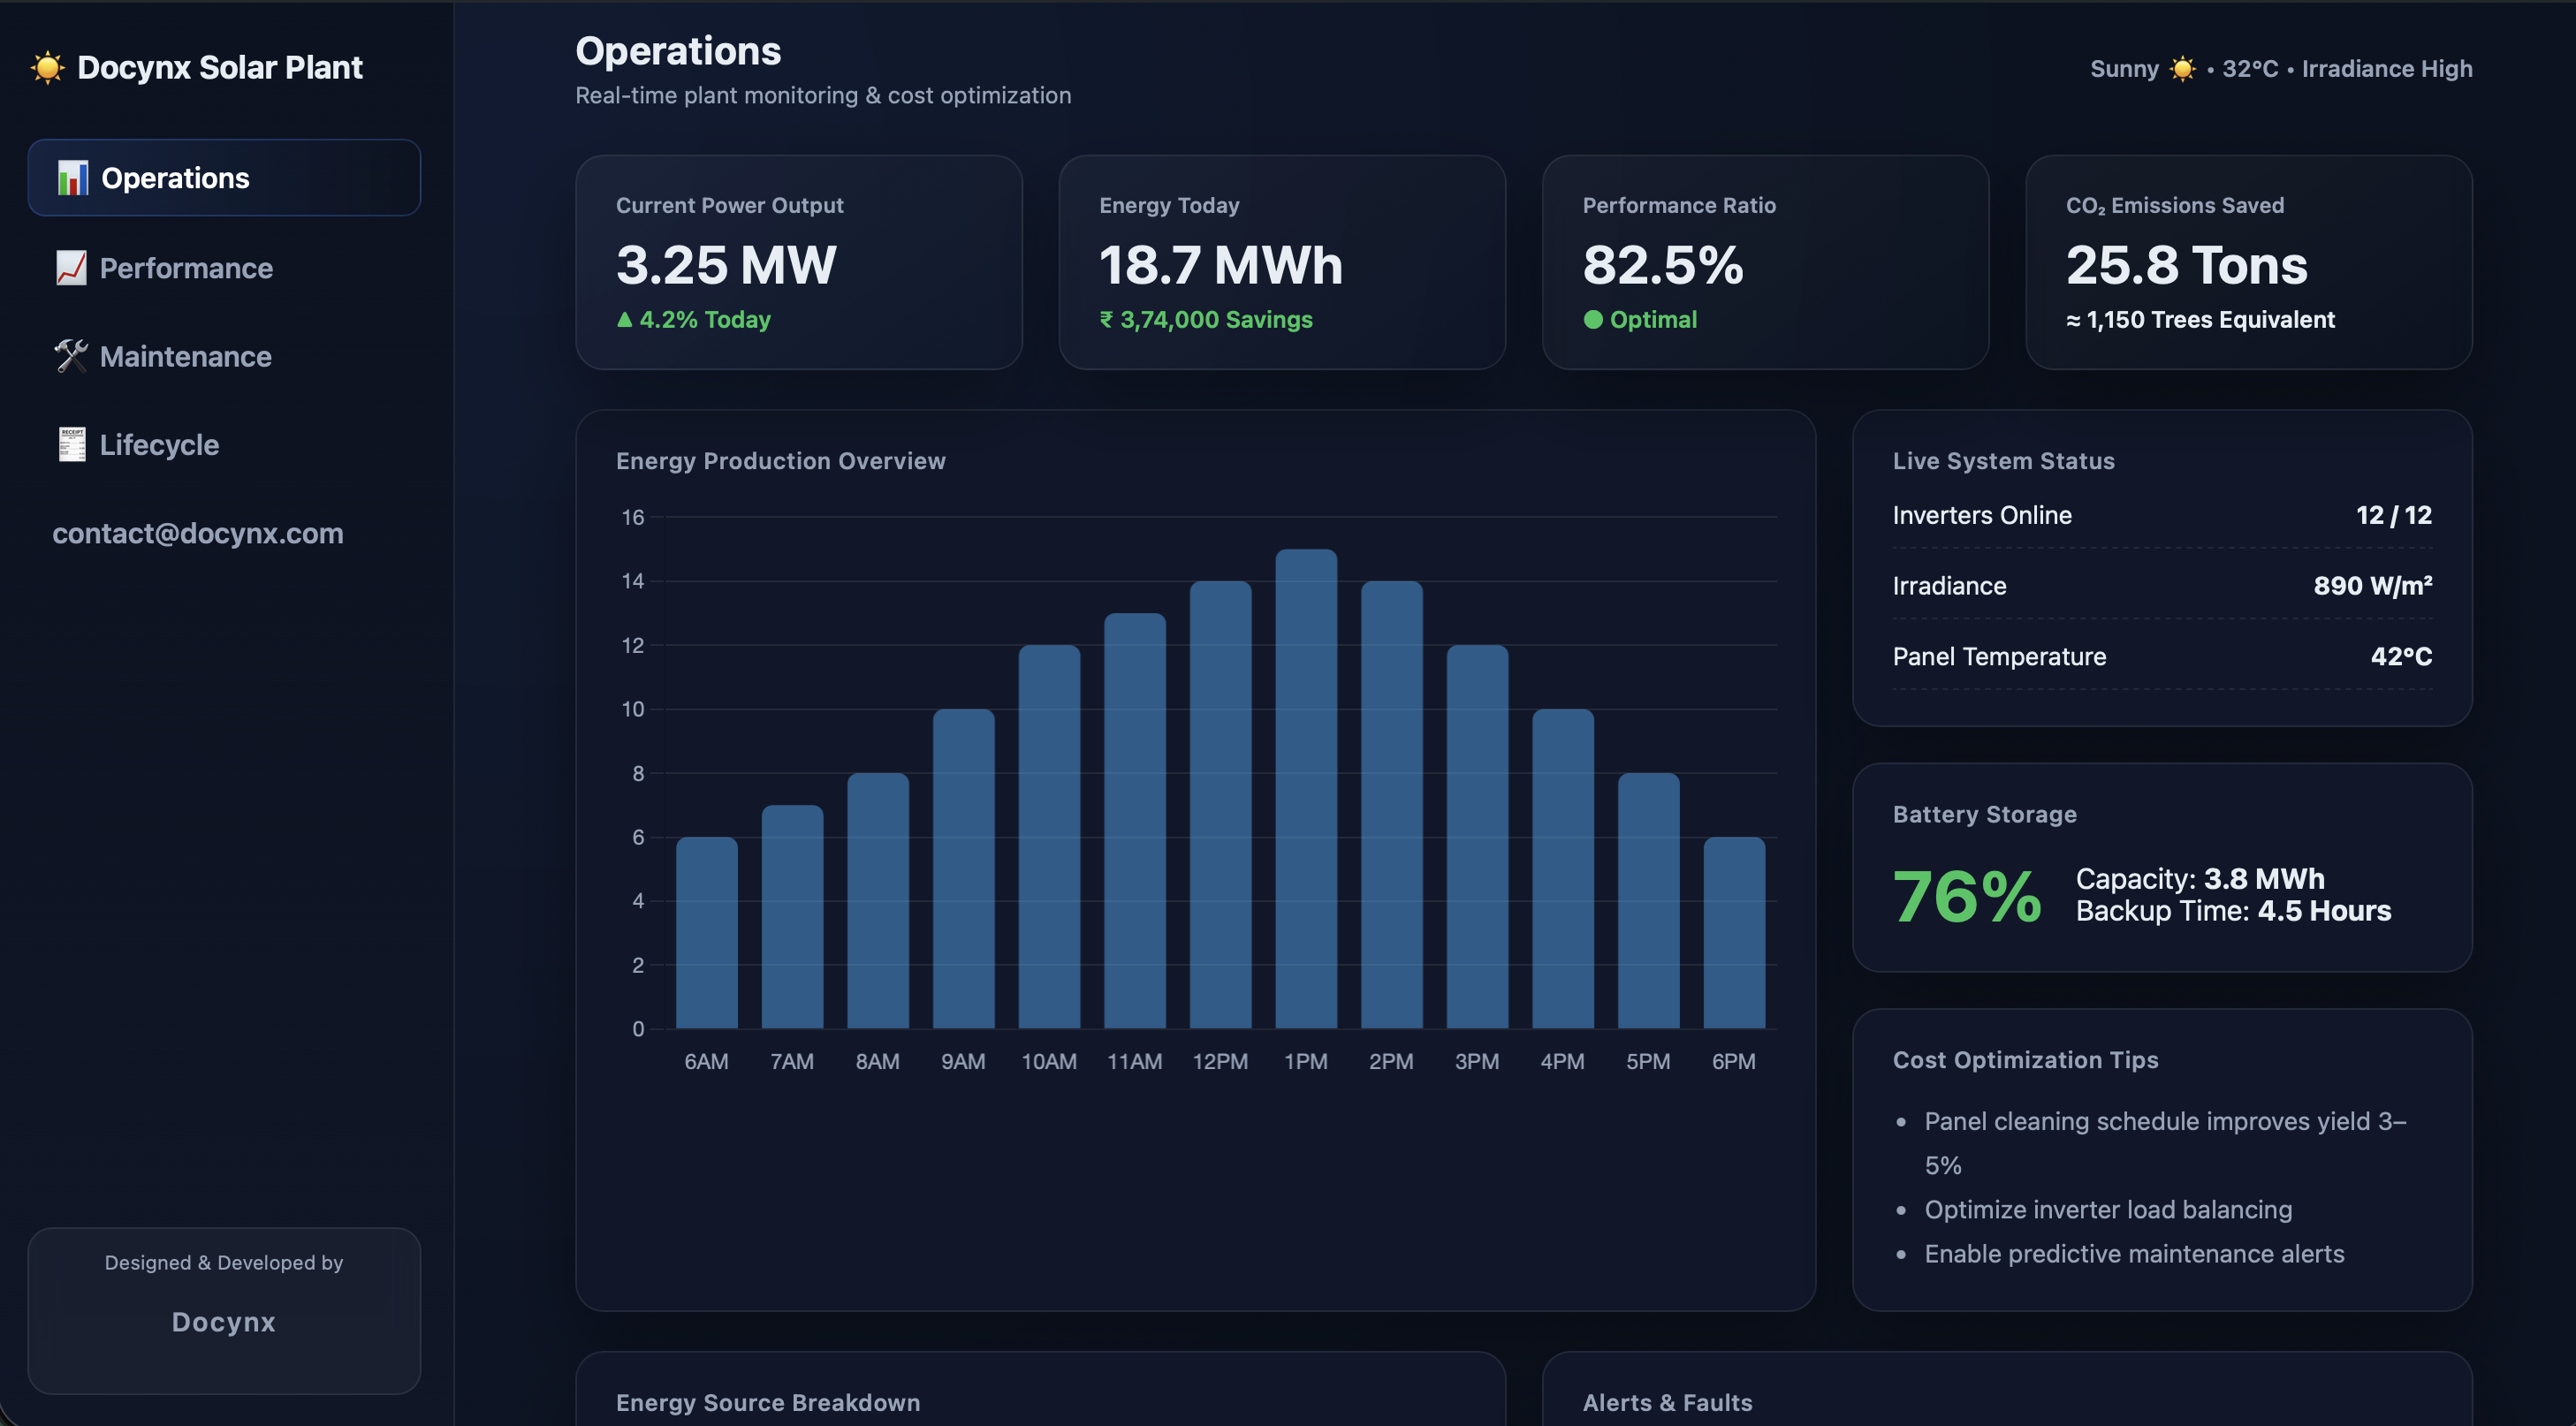 Web demo
Solar Energy Analytics Dashboard
Track solar plant performance, energy generation trends, inverter efficiency, downtime analysis, and operational KPIs in one interactive dashboard.
View Dashboard →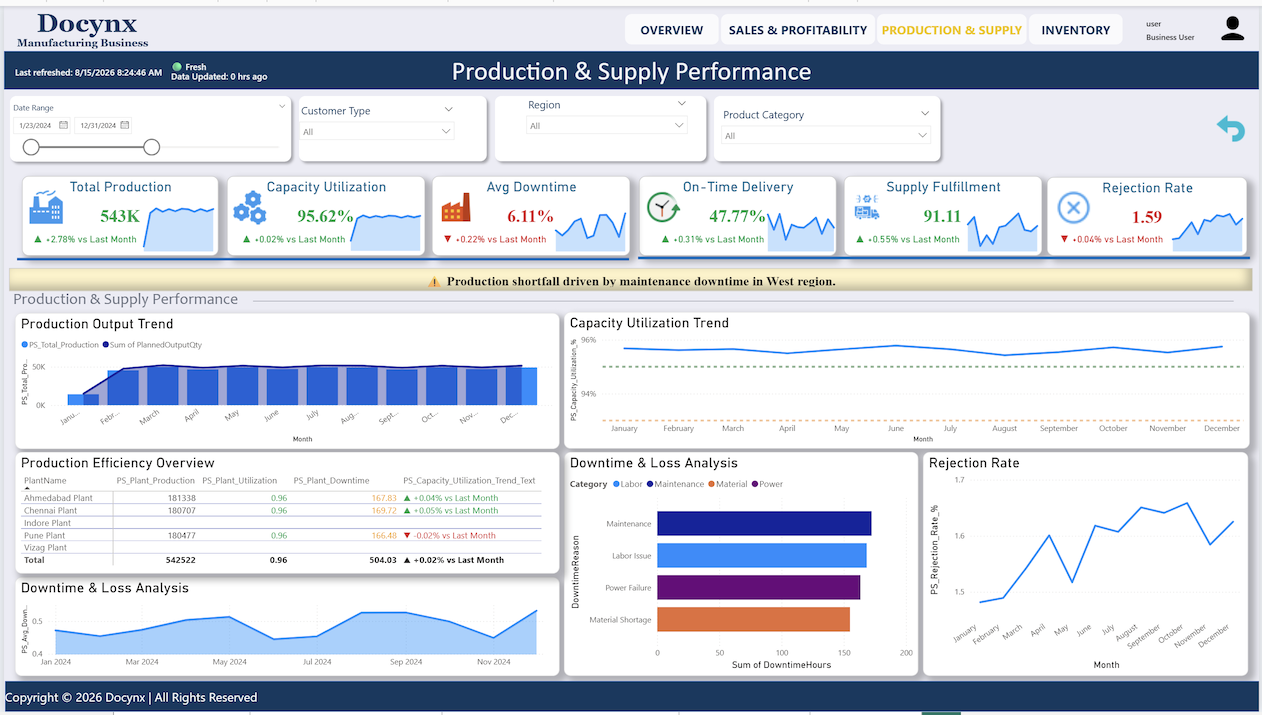 Power BI
Manufacturing Business Dashboard
An in-depth data analysis of a manufacturing business dashboard, covering customer health, revenue concentration, production output, capacity utilization, and downtime analytics with Docynx.
View Dashboard →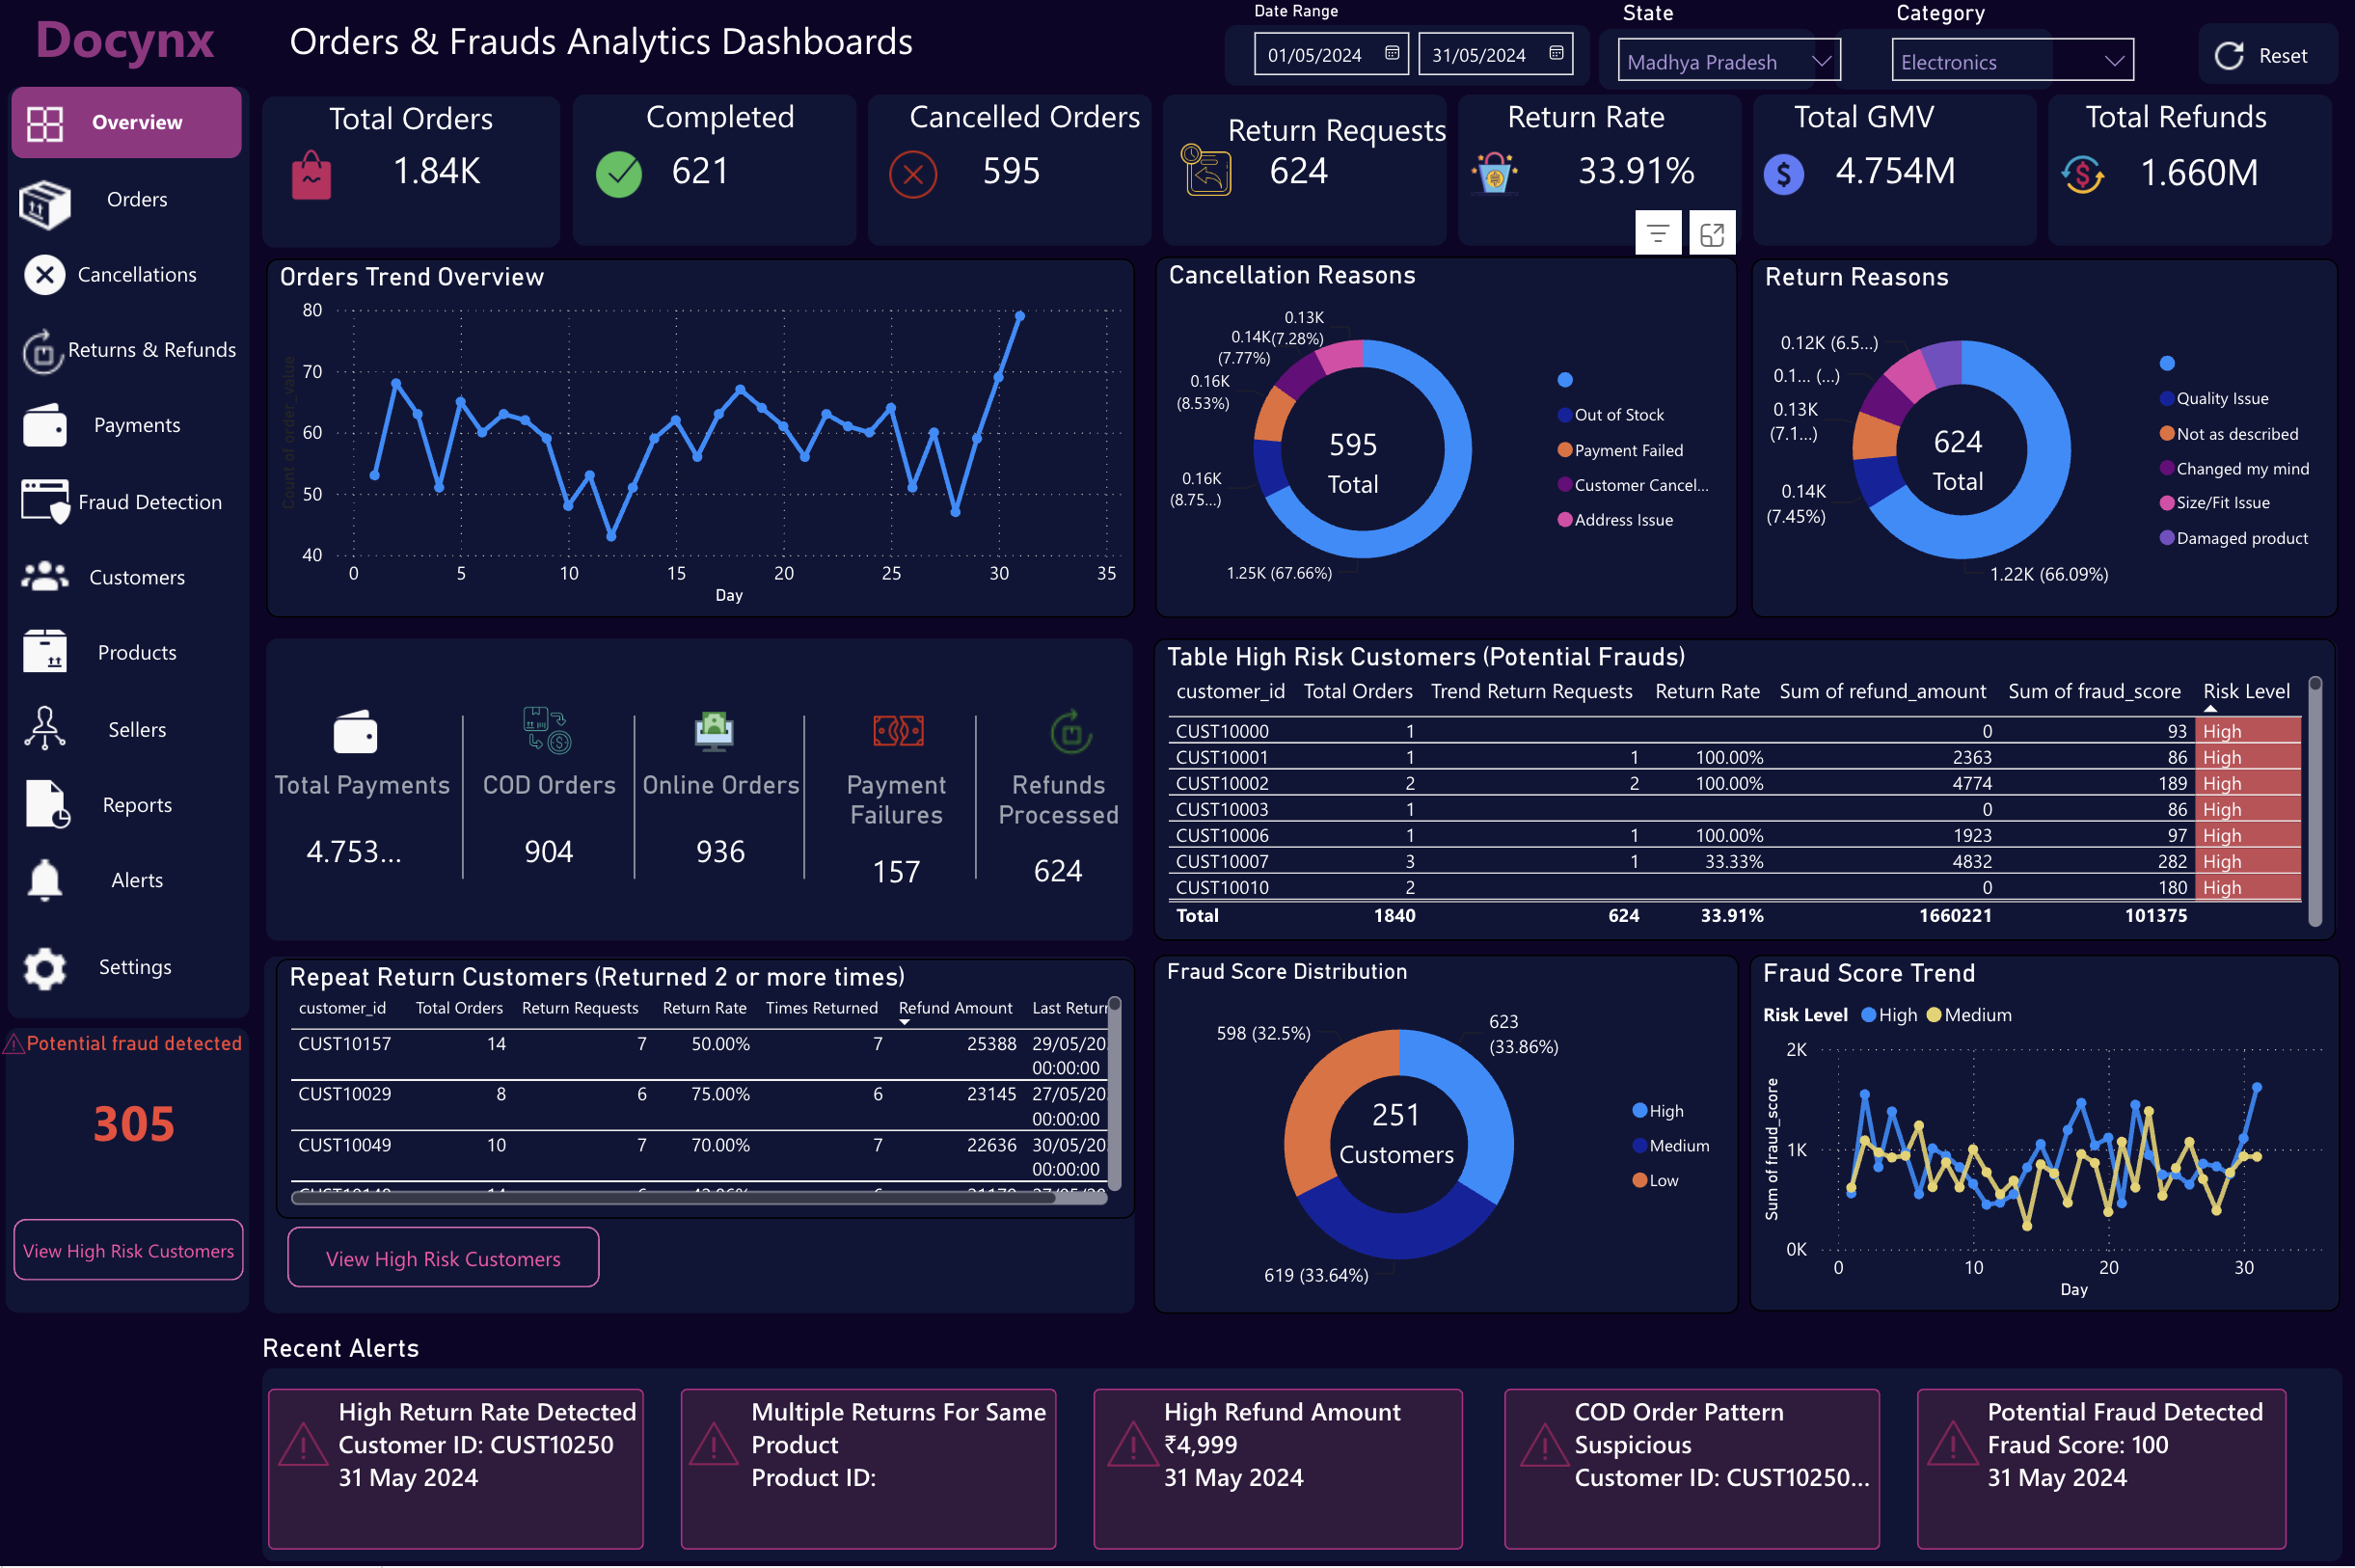 Power BI
E-Commerce Orders & Fraud Analytics Dashboard
Explore real-time e-commerce performance, order lifecycle trends, cancellations, returns, payment behavior, customer analytics, and fraud risk monitoring through an interactive Power BI dashboard.
View Dashboard →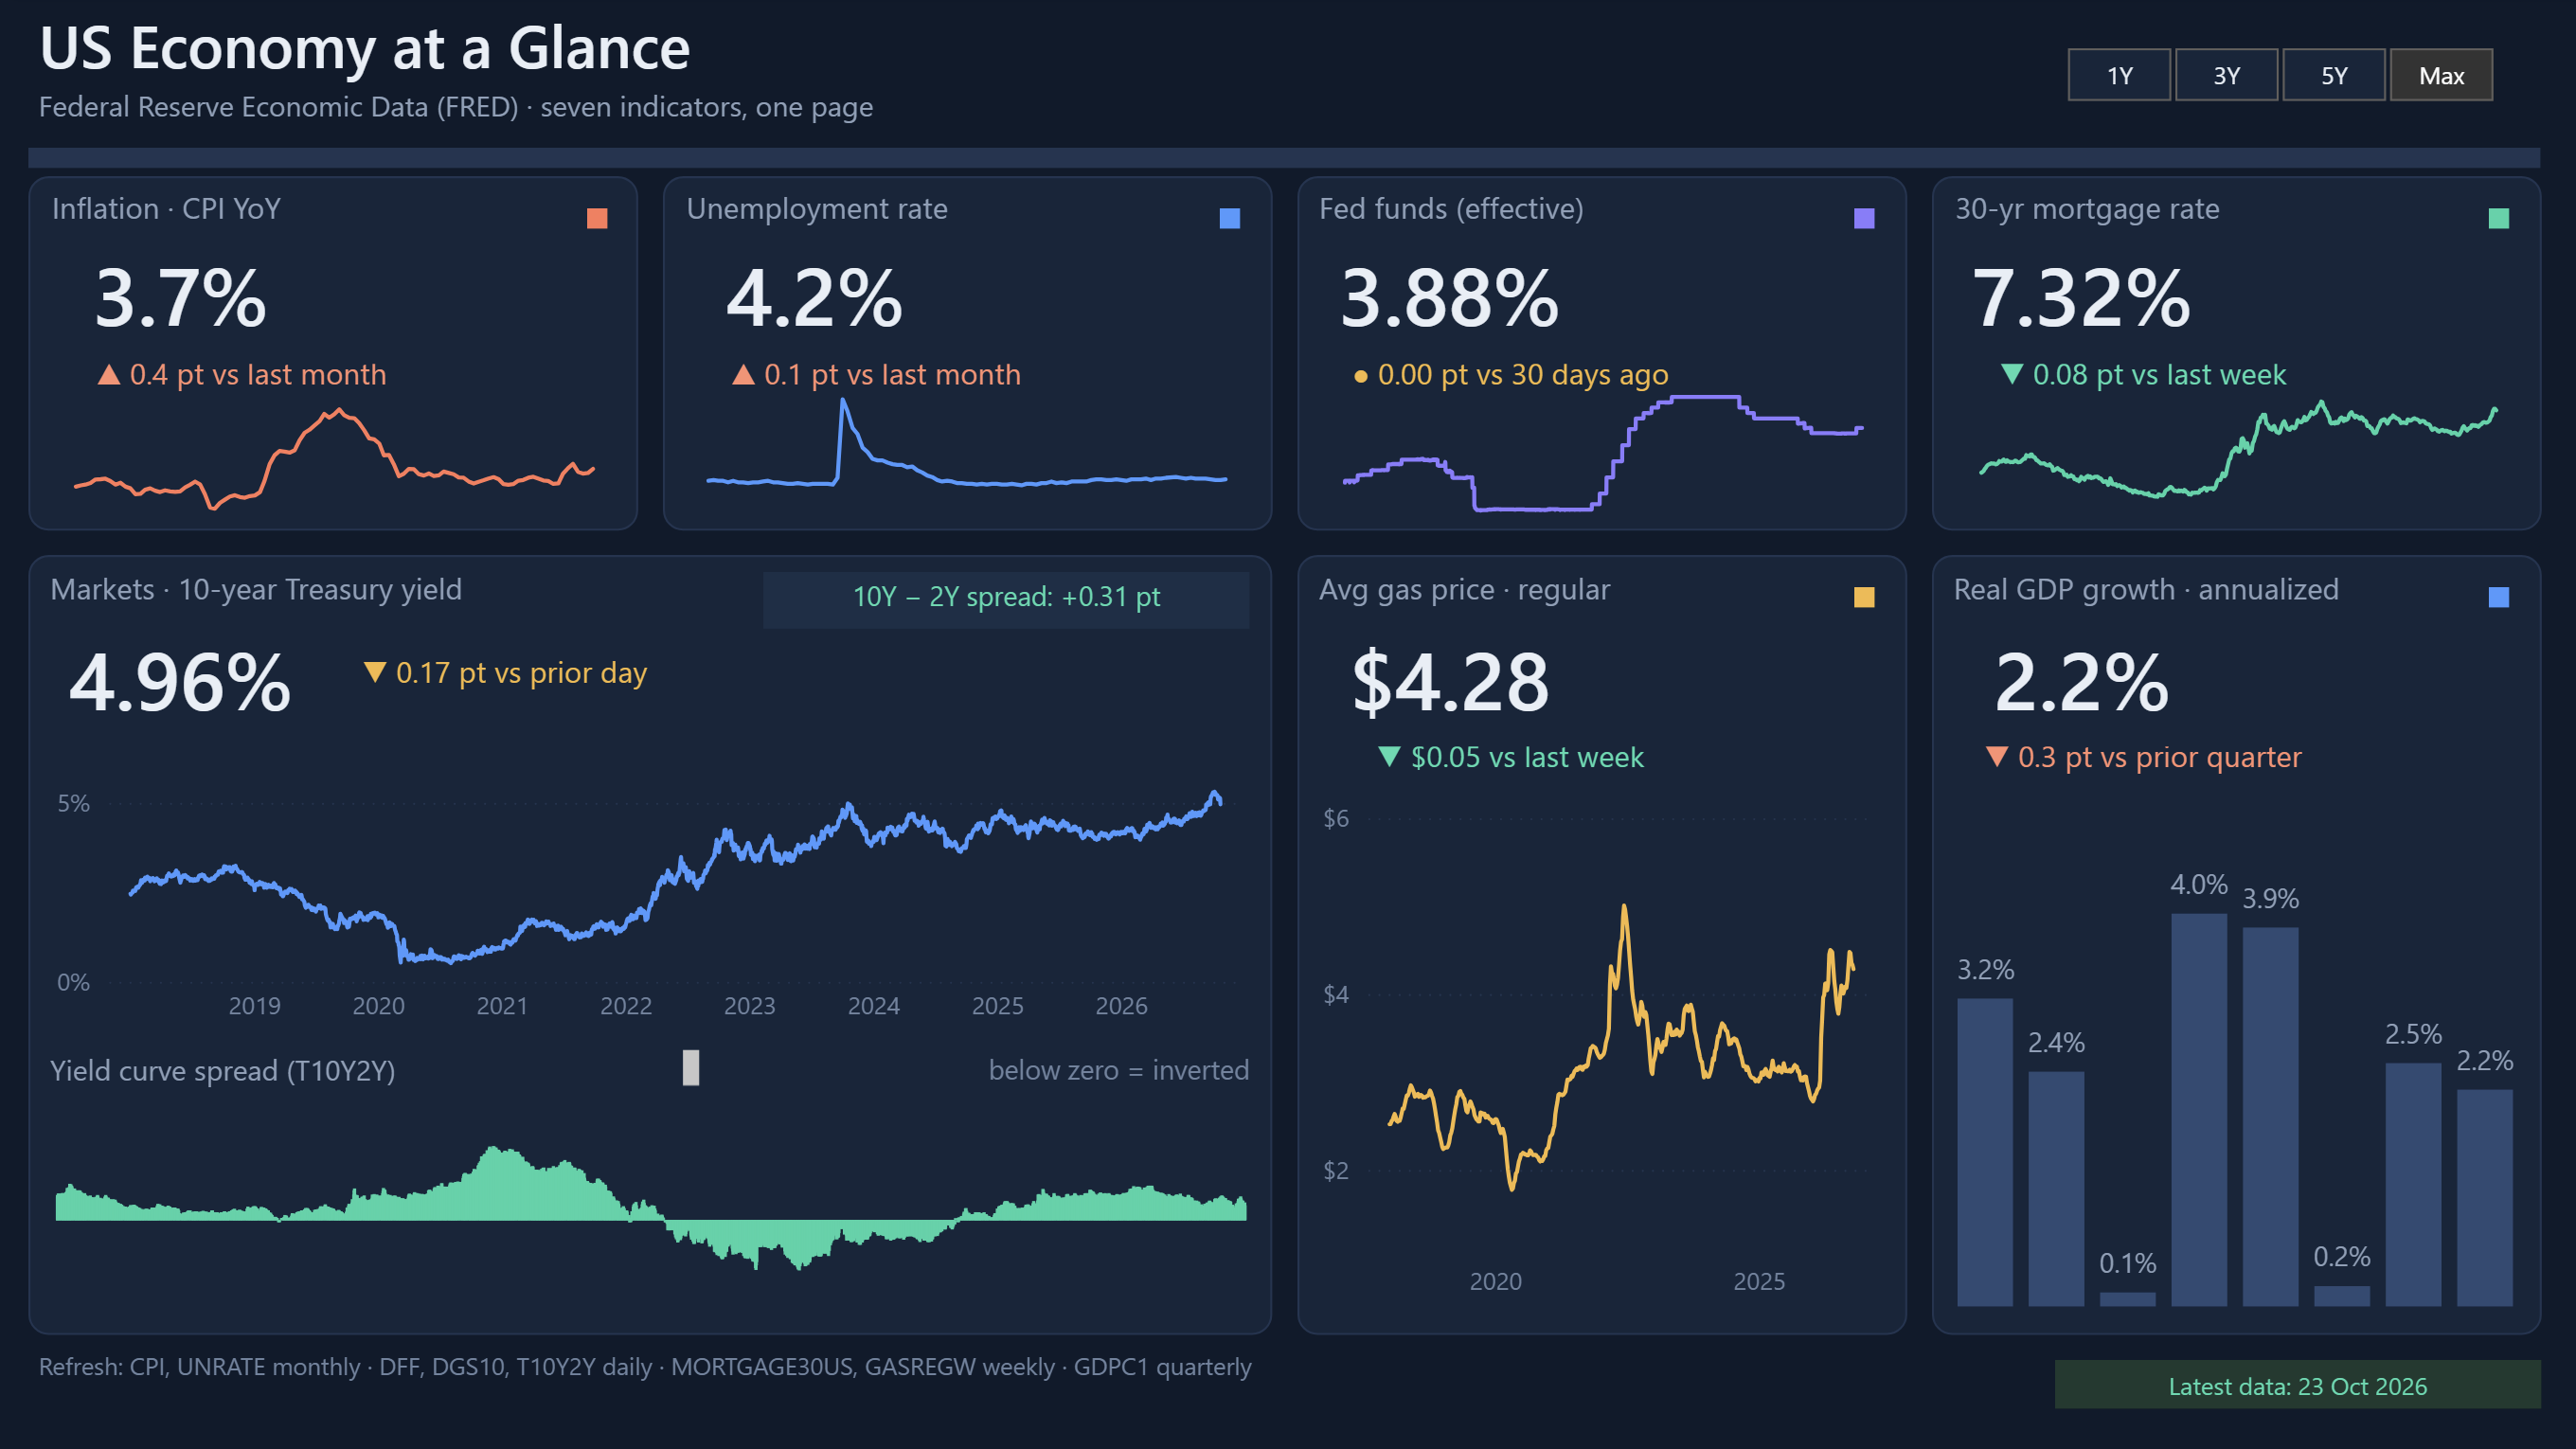 Free PBIX download
US Economy at a Glance
One-page economic dashboard tracking inflation, unemployment, the Fed funds rate, mortgage rates, the 10-year Treasury yield, gas prices and GDP growth from Federal Reserve (FRED) data.
View Dashboard →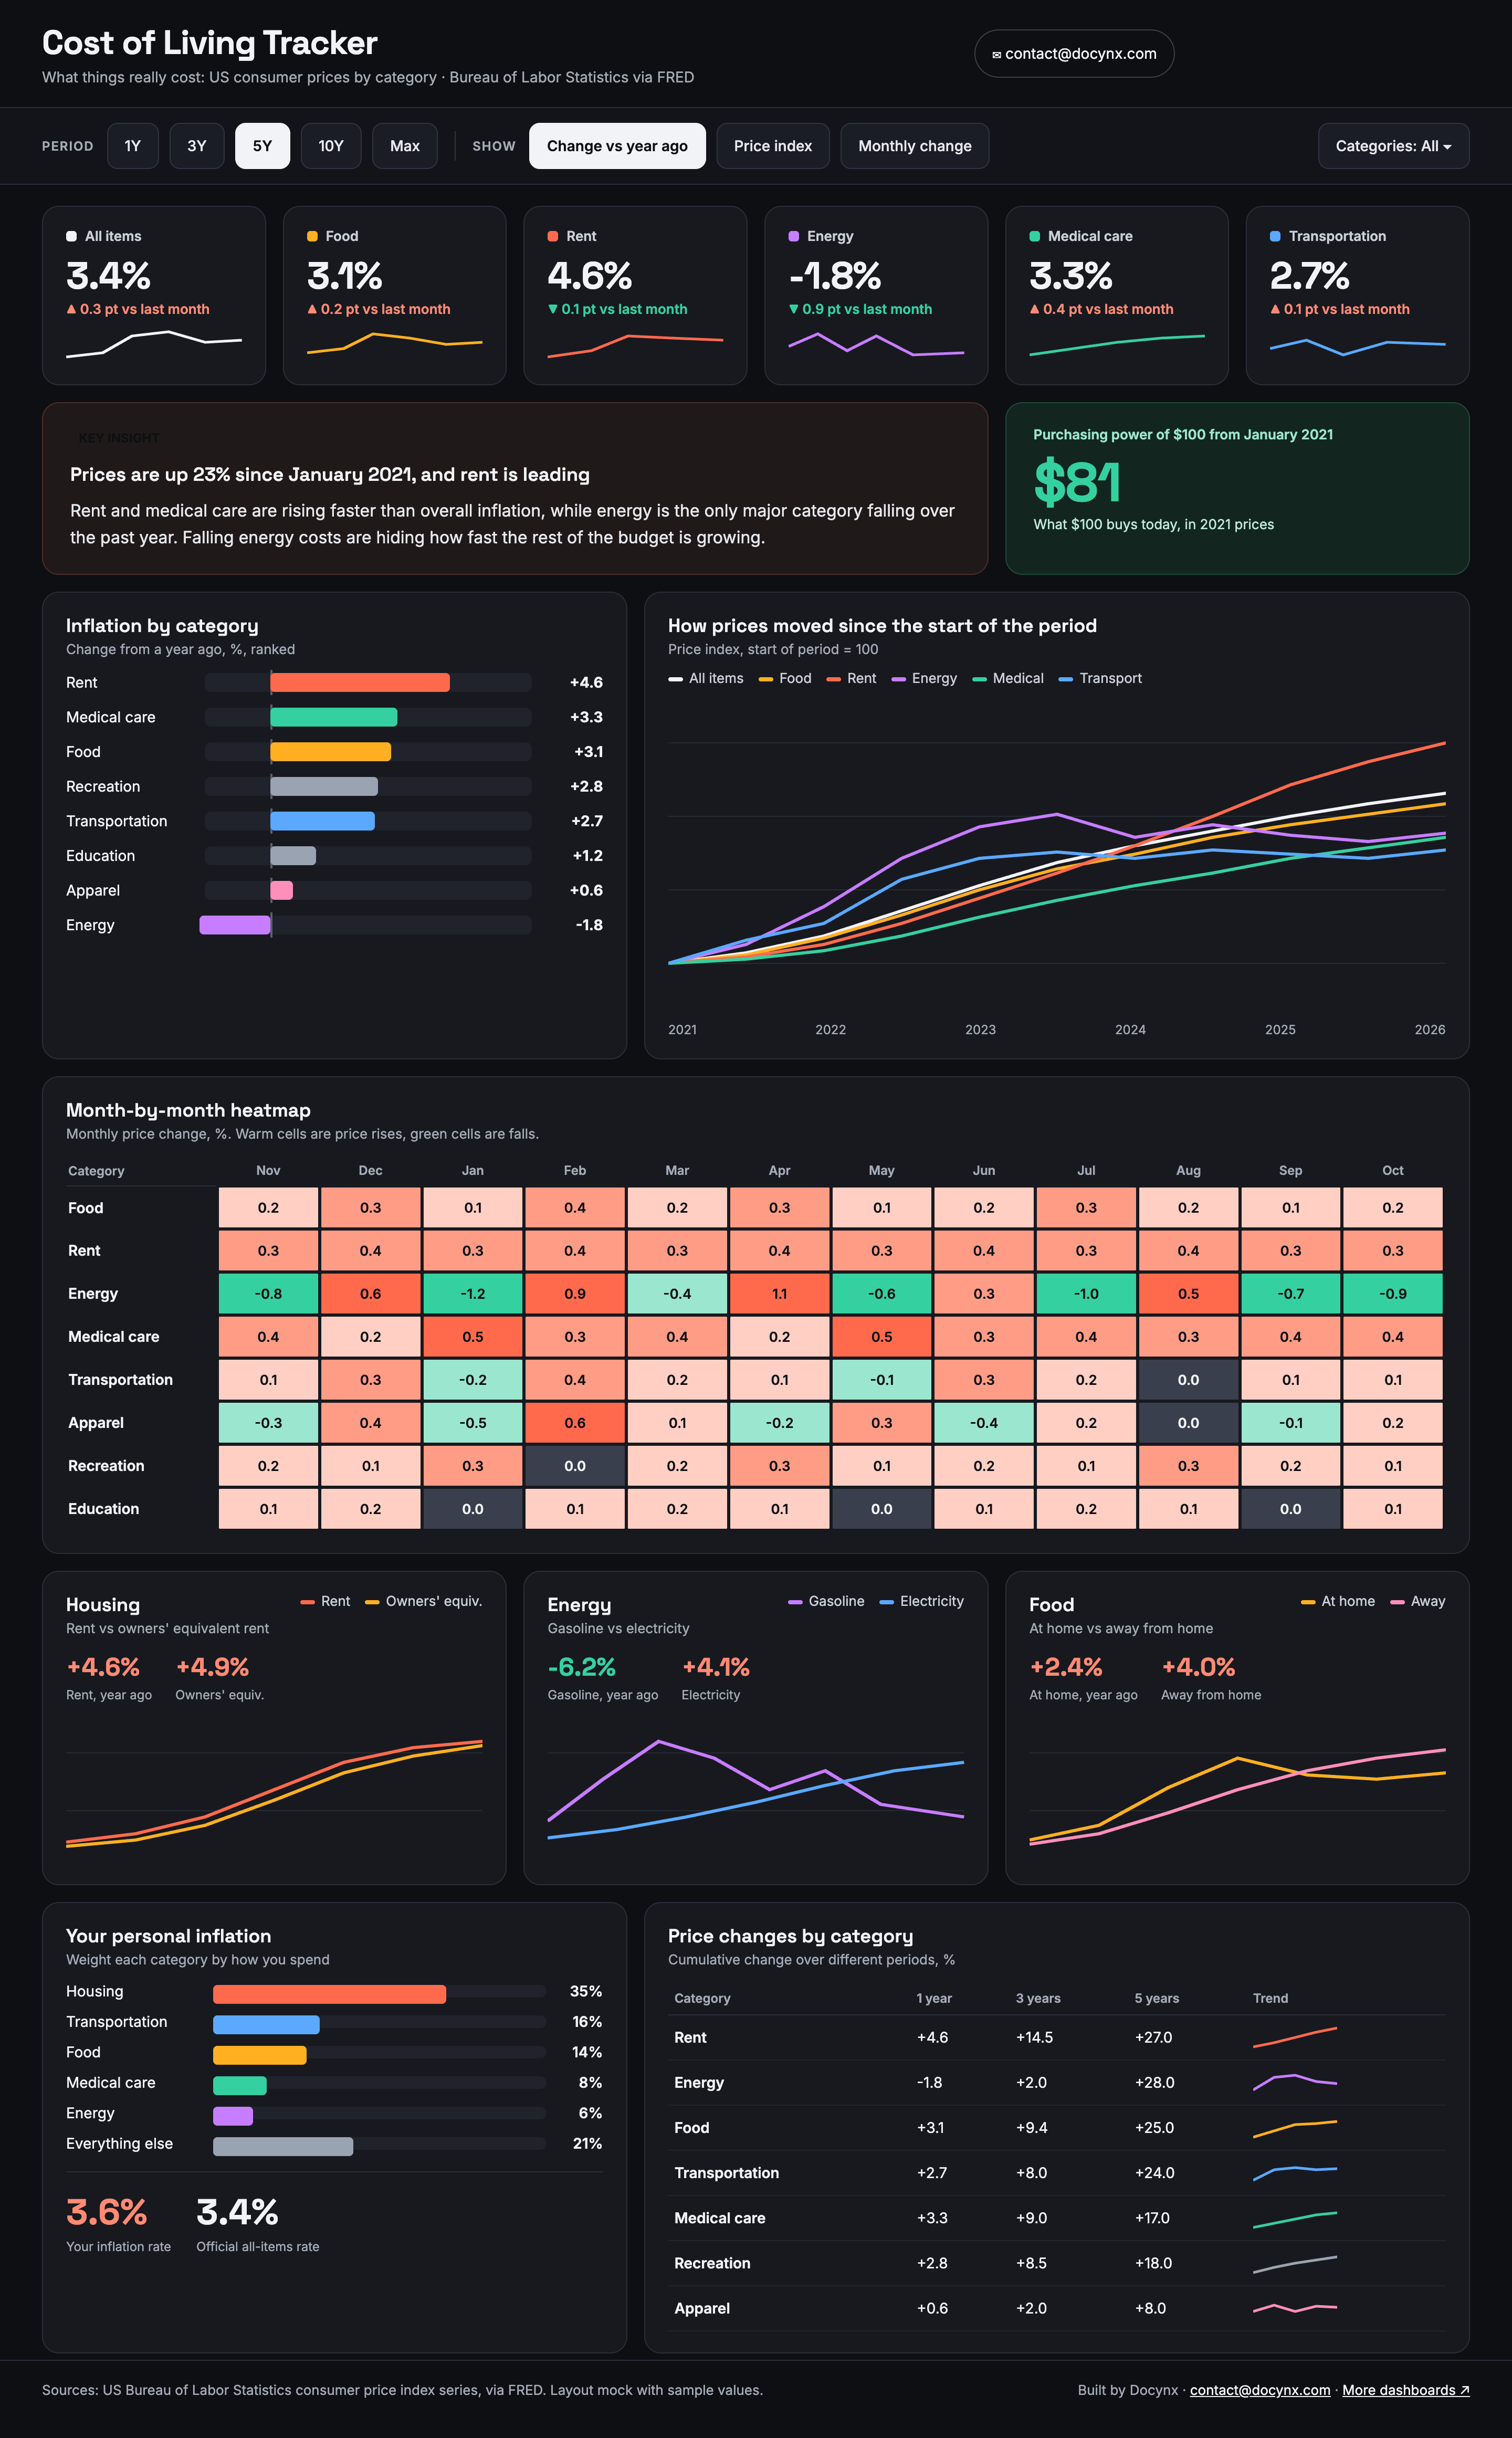 Free PBIX download
Cost of Living Tracker
Free Power BI dashboard that breaks US inflation into food, rent, energy, medical care, transportation and more, with a monthly heatmap and a personal inflation view, using BLS data from FRED.
View Dashboard →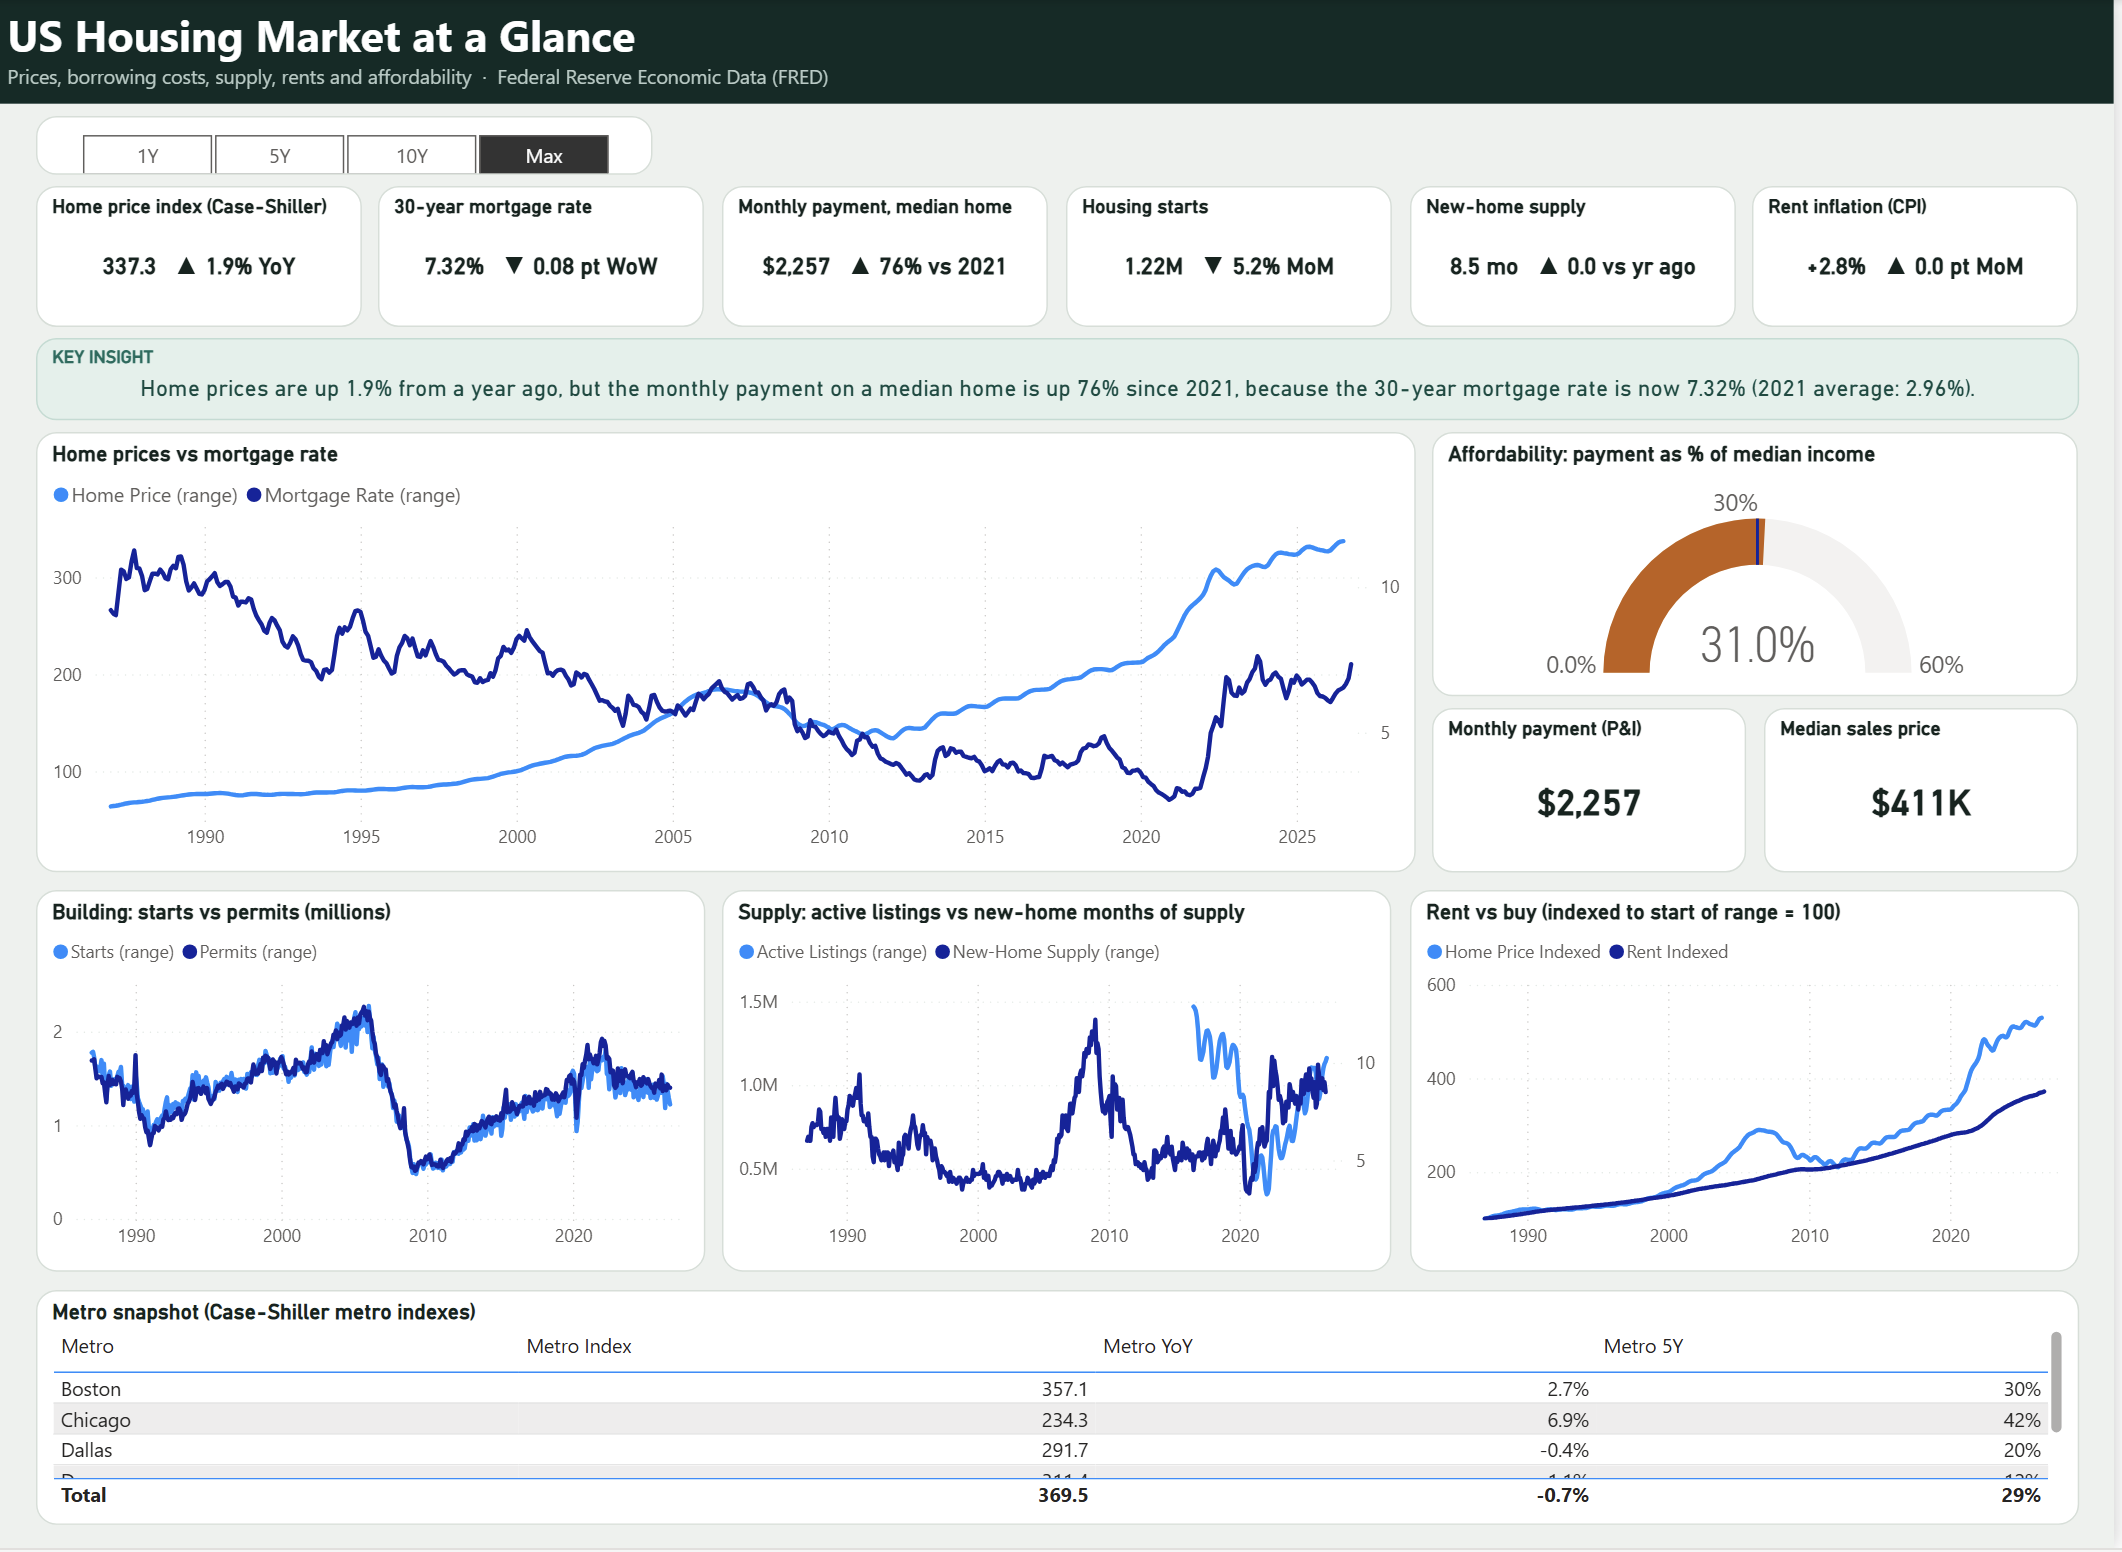 Free PBIX download
US Housing Market at a Glance
Free Power BI dashboard tracking US home prices, mortgage rates, monthly payments, affordability, housing starts, supply, rents and metro prices from Federal Reserve (FRED) data.
View Dashboard →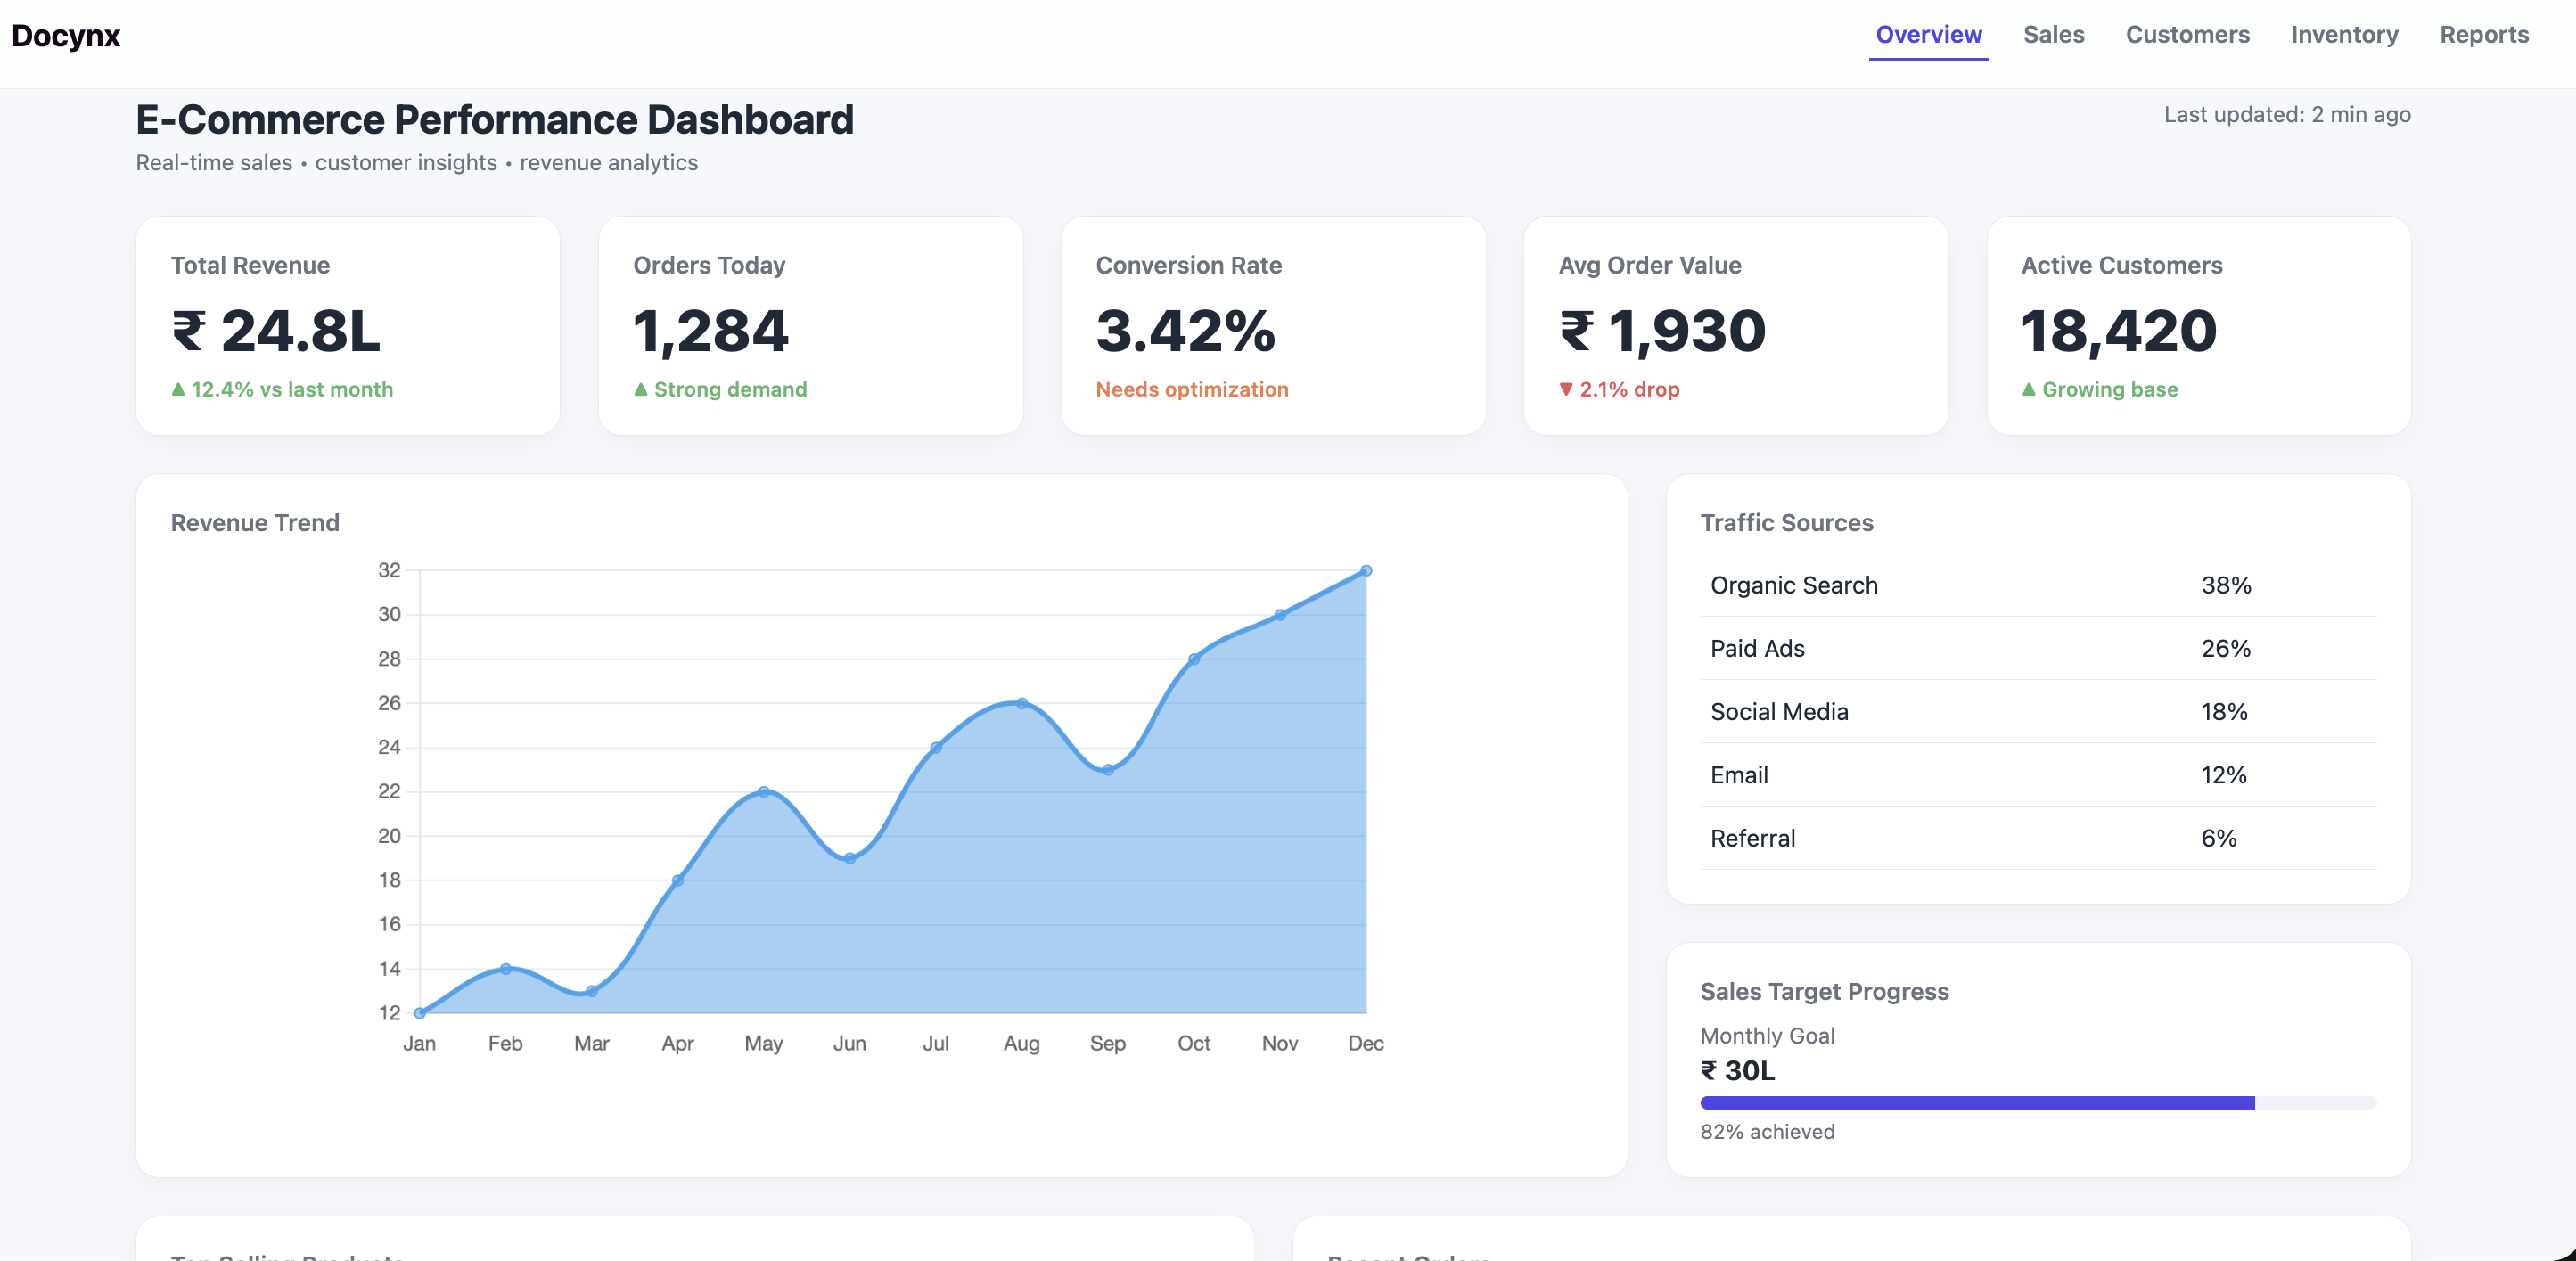 Web demo
E-Commerce Performance Dashboard
Powerful e-commerce analytics dashboard with real-time sales, customer insights, inventory tracking, and business reports.
View Dashboard →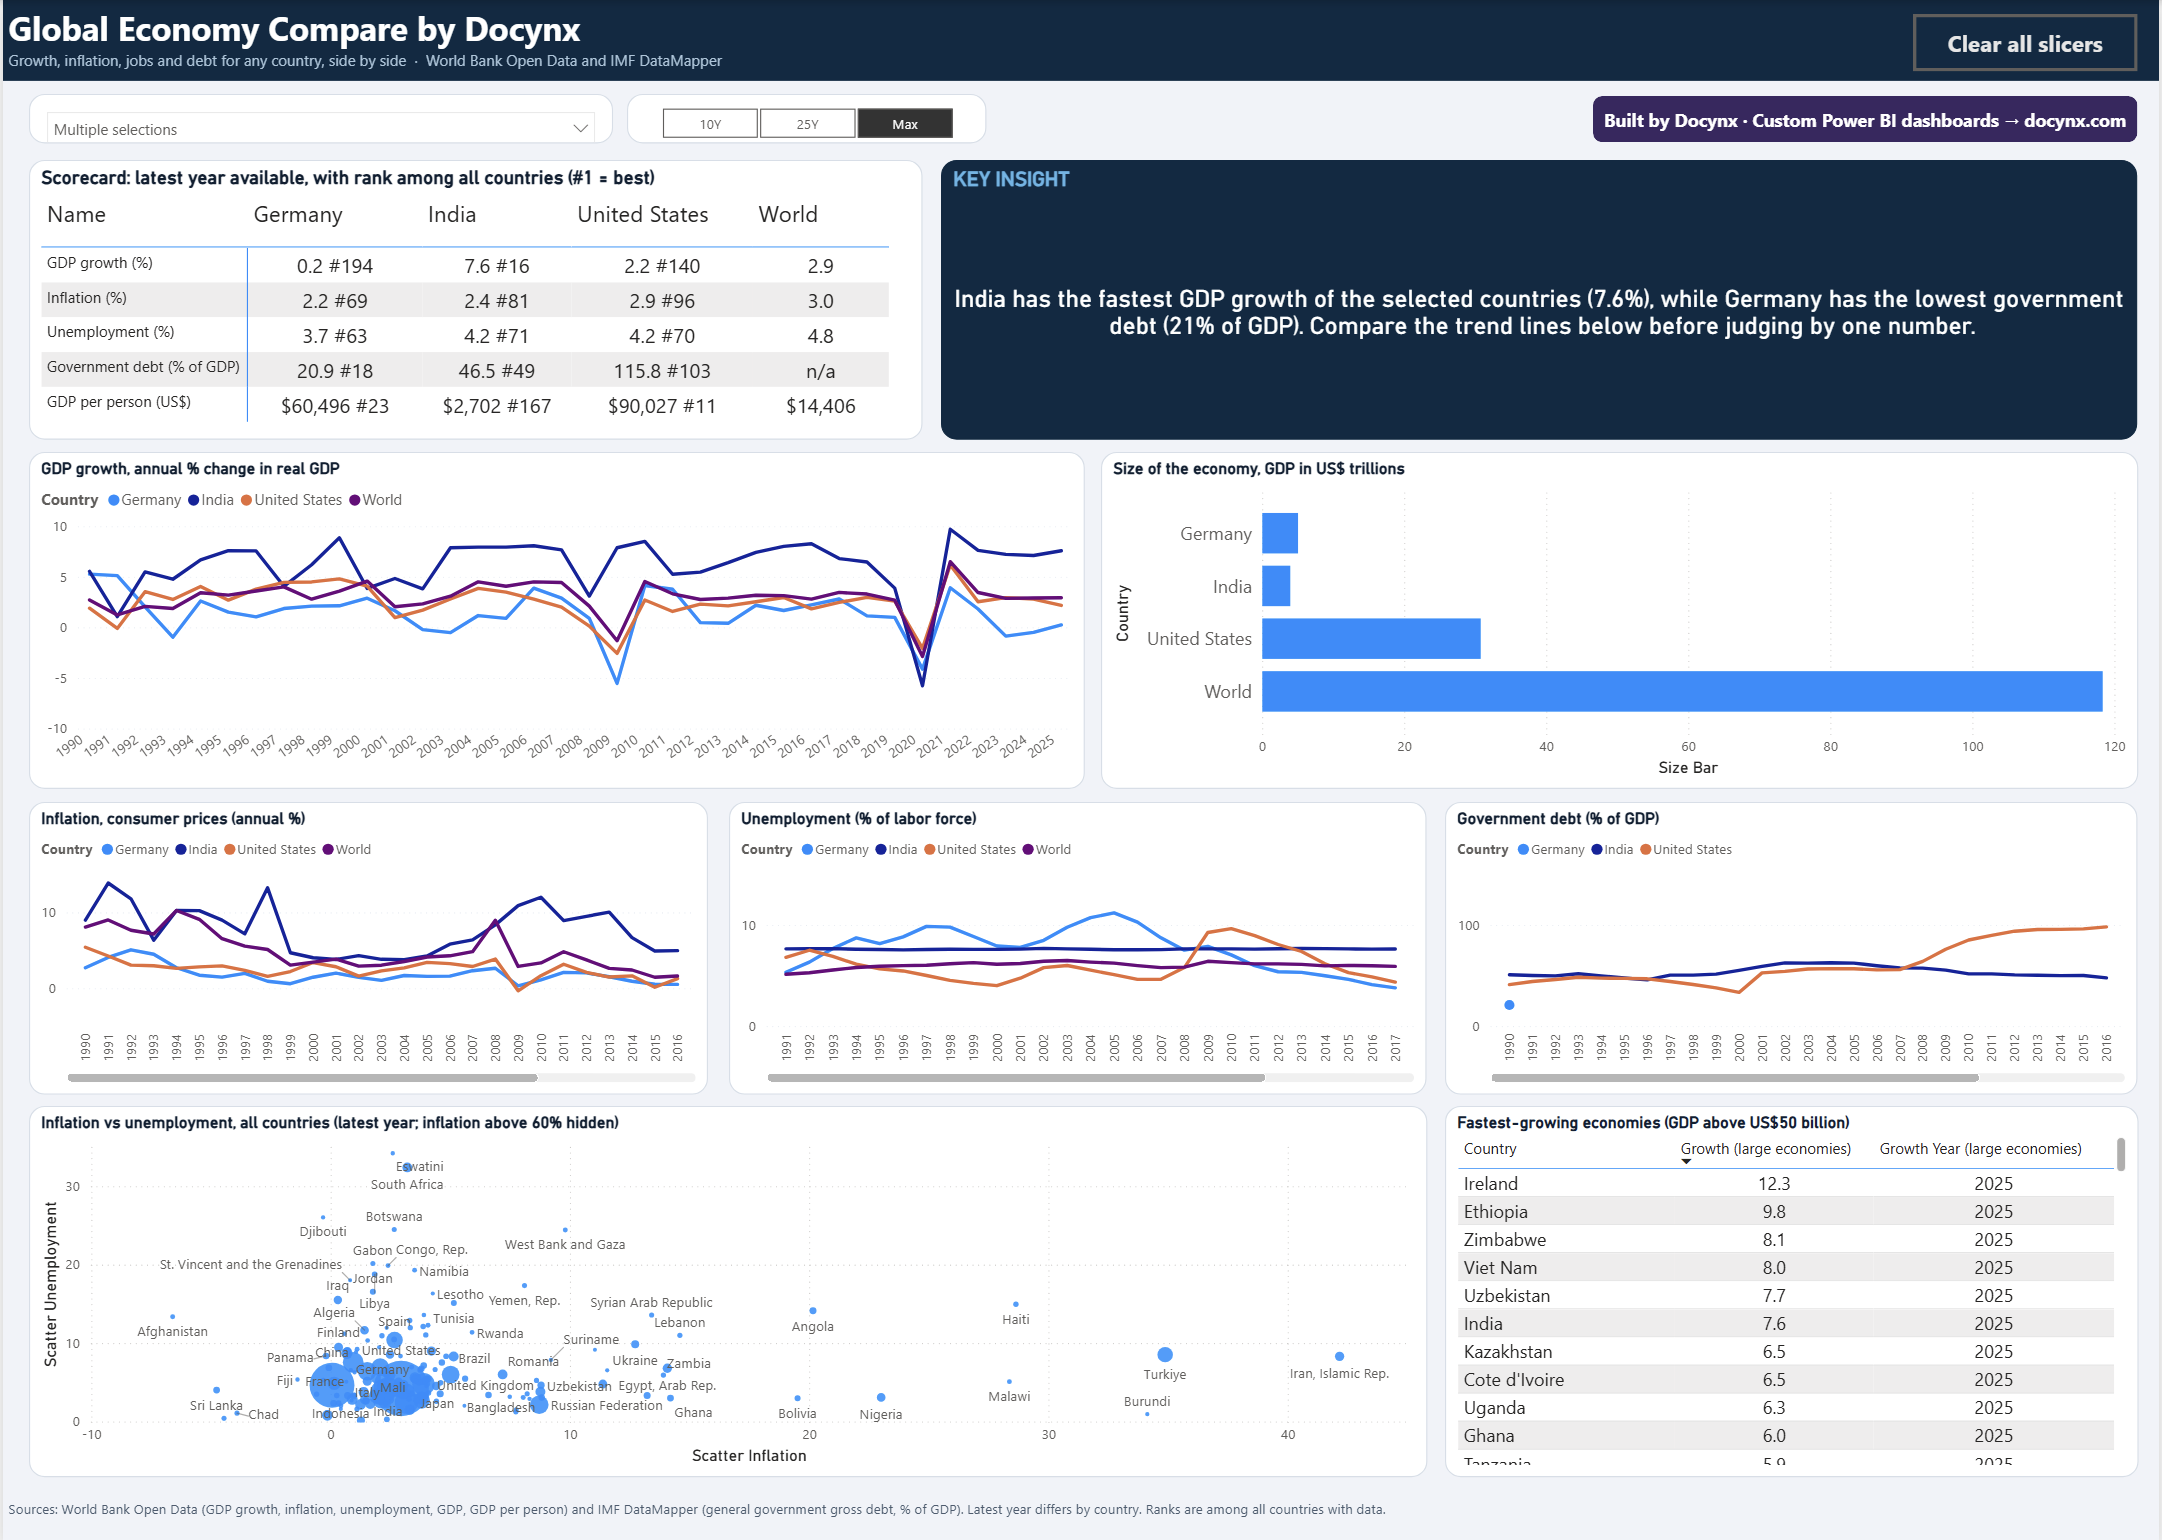 Free PBIX download
Global Economy Compare
Free Power BI dashboard to compare any countries on GDP growth, inflation, unemployment, government debt and income per person, with ranks among all countries, using World Bank and IMF open data.
View Dashboard →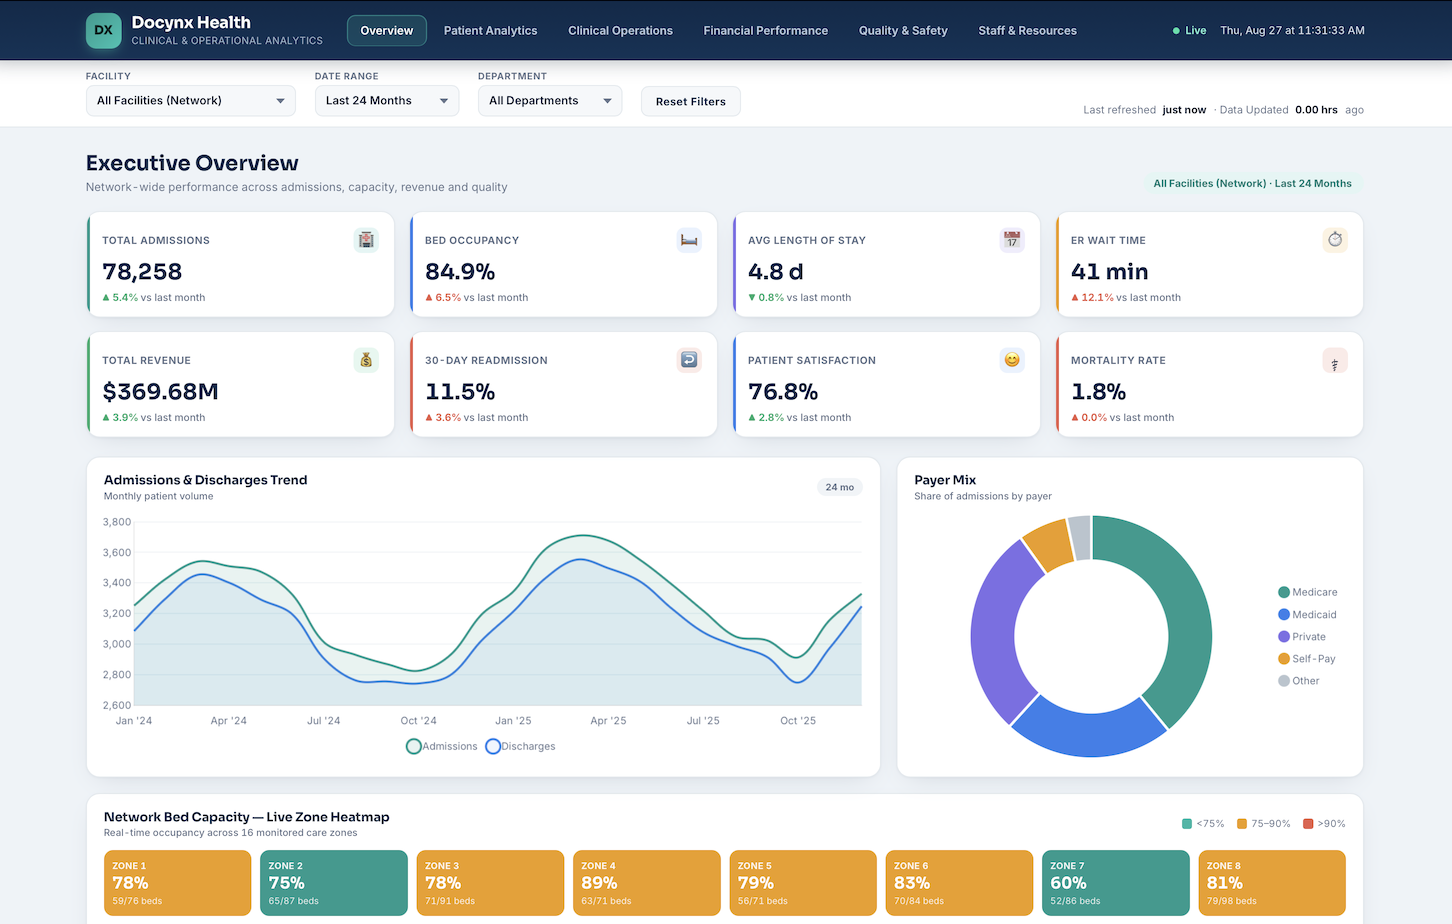 Web demo
Docynx Healthcare Dashboard
Docynx Healthcare Dashboard for hospital performance, patient, financial, and clinical analytics. Interactive KPIs, trends, bed occupancy, alerts, and operational insights. Fully dynamic filters with consistent synthetic healthcare data.
View Dashboard →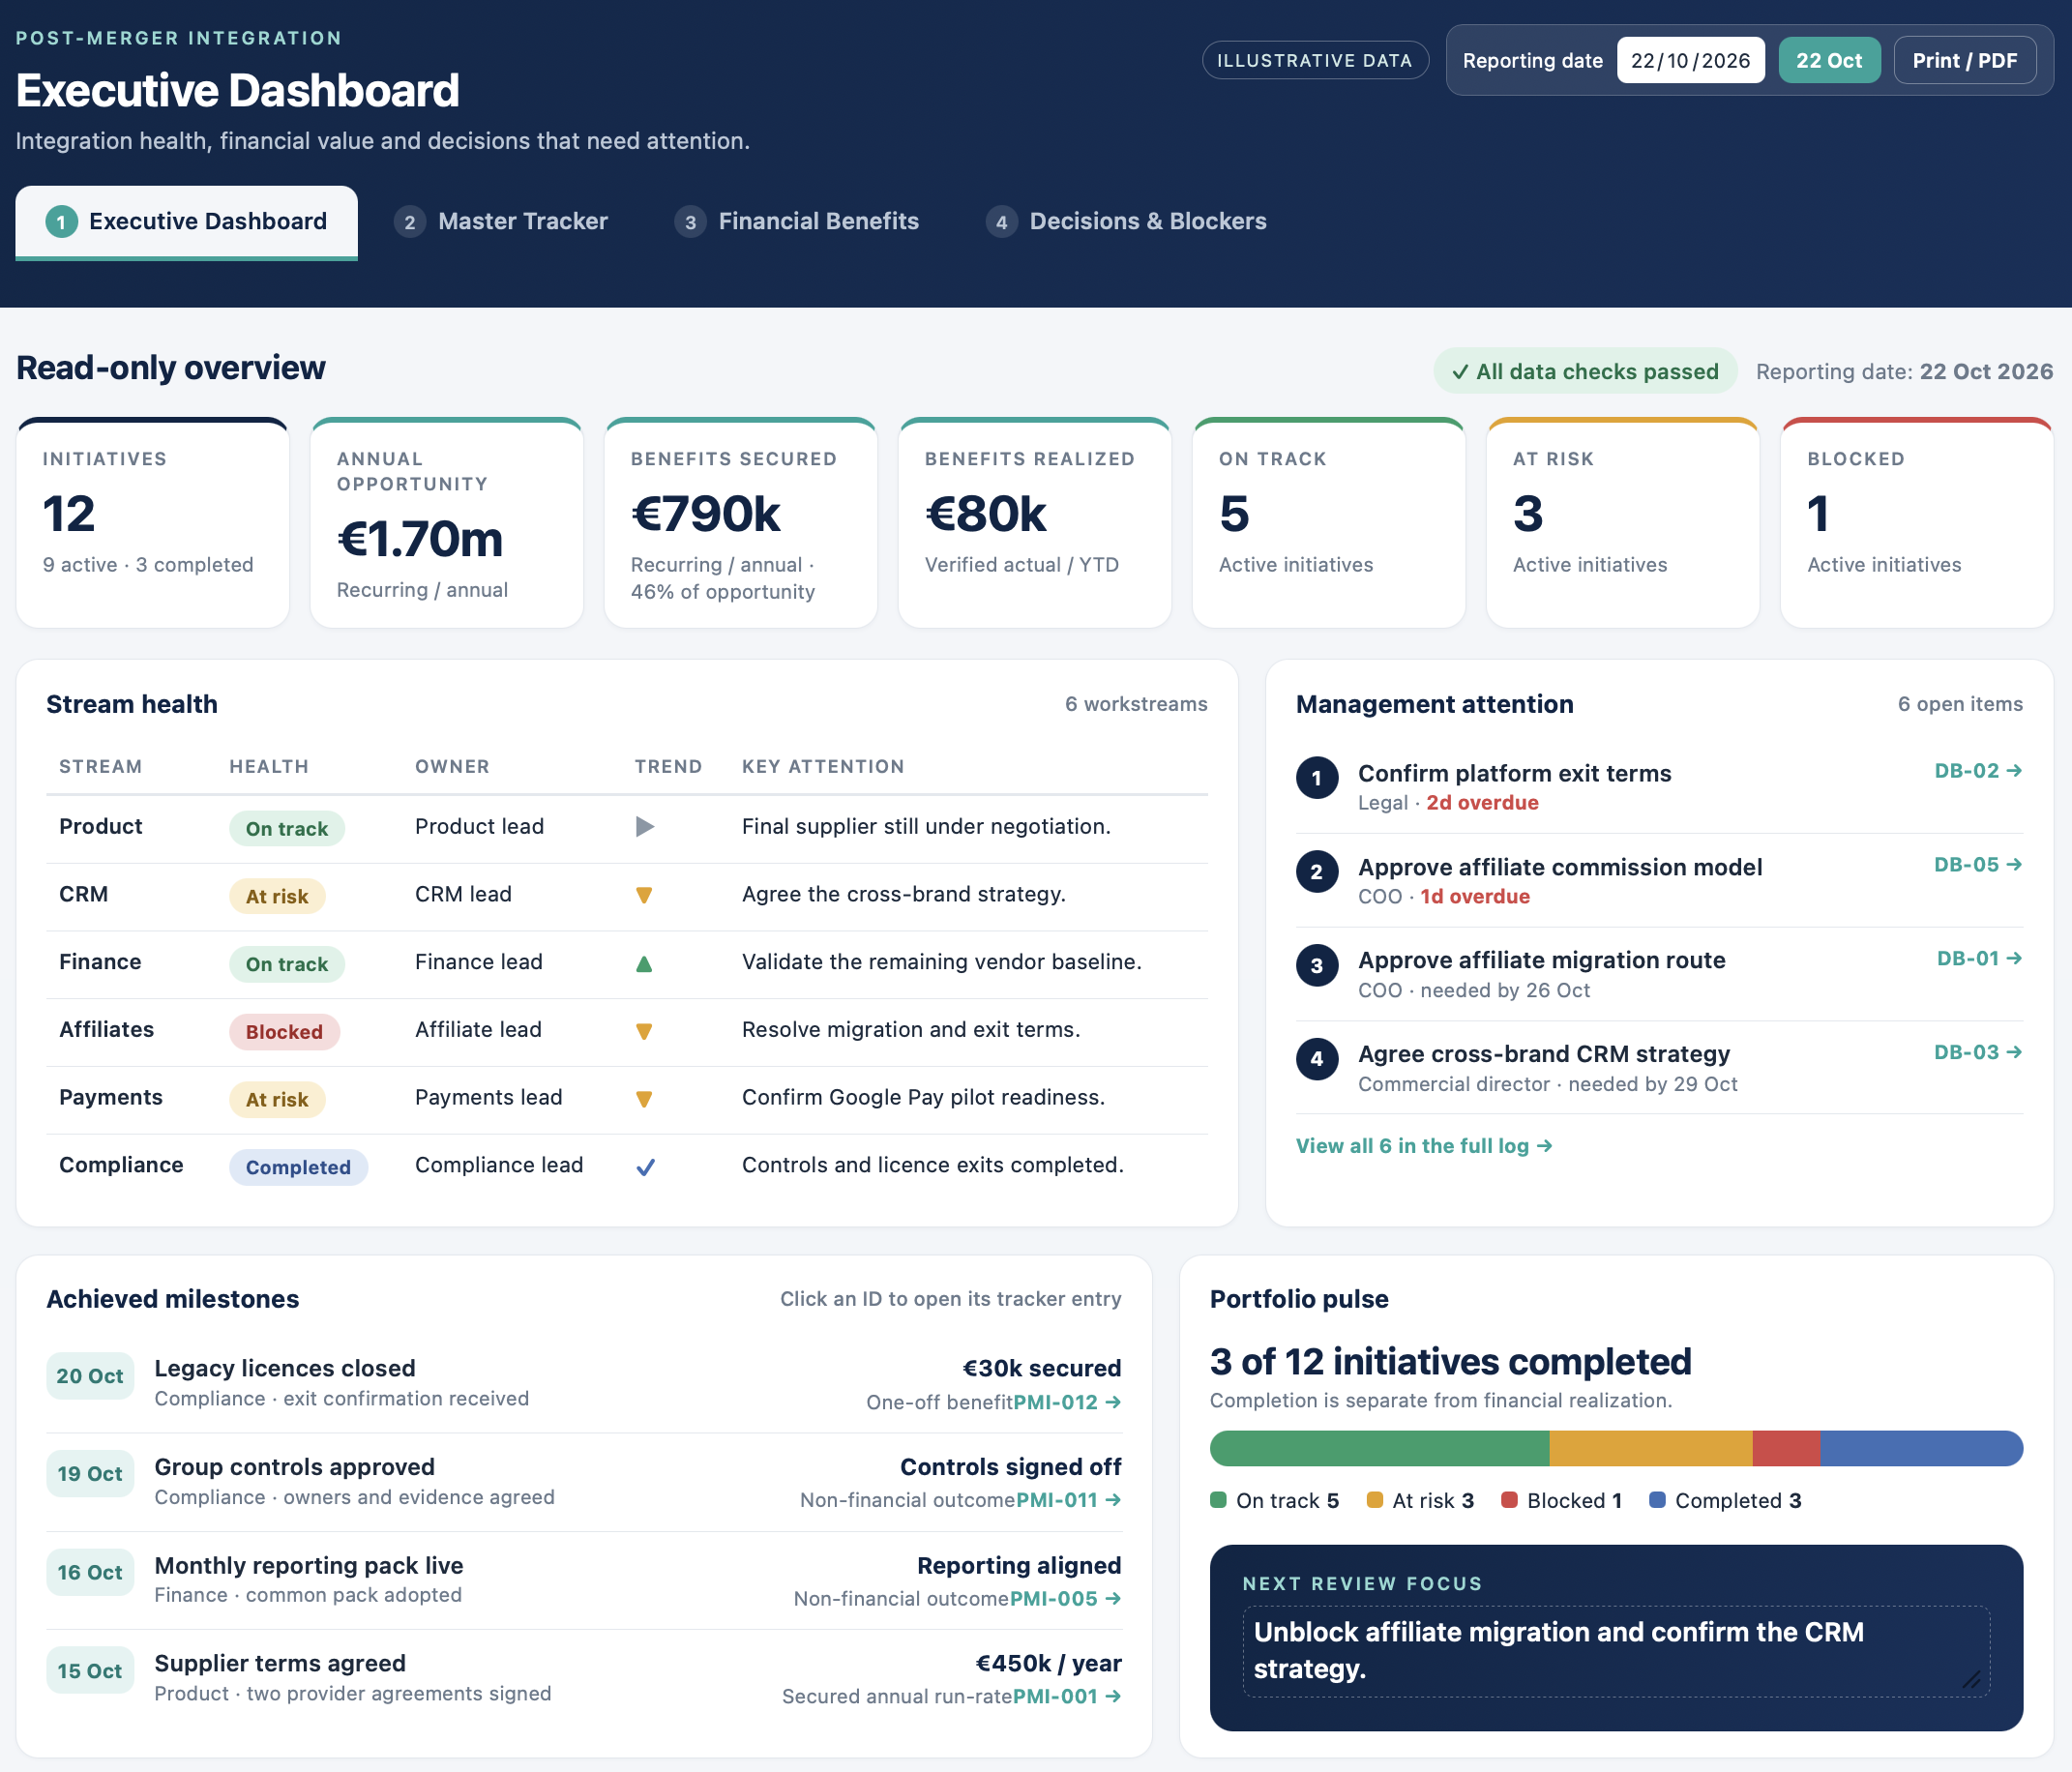 Web demo
Docynx Post-Merger Integration Dashboard
Docynx Post-Merger Integration Dashboard for executive reporting across initiatives, financial benefits, and decisions. Interactive KPIs, stream health, milestones, blocker tracking, and escalation alerts. Fully linked tabs with a reporting-date control and consistent synthetic integration data.
View Dashboard →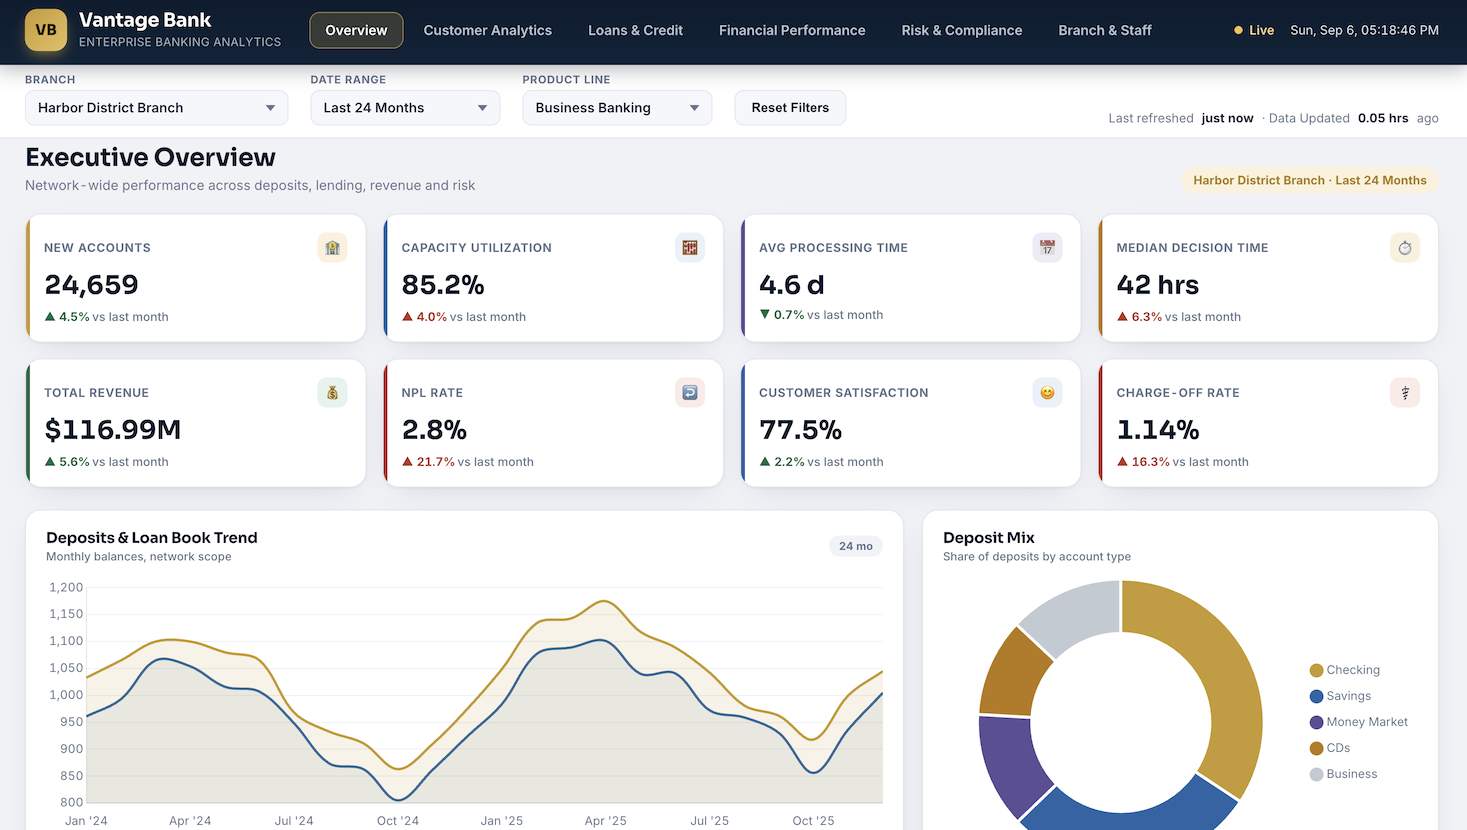 Web demo
Enterprise Banking Analytics
Modern executive banking analytics dashboard to provide a consolidated view of banking performance, customer activity, lending, revenue, and risk.
View Dashboard →