ENERGY ANALYTICS
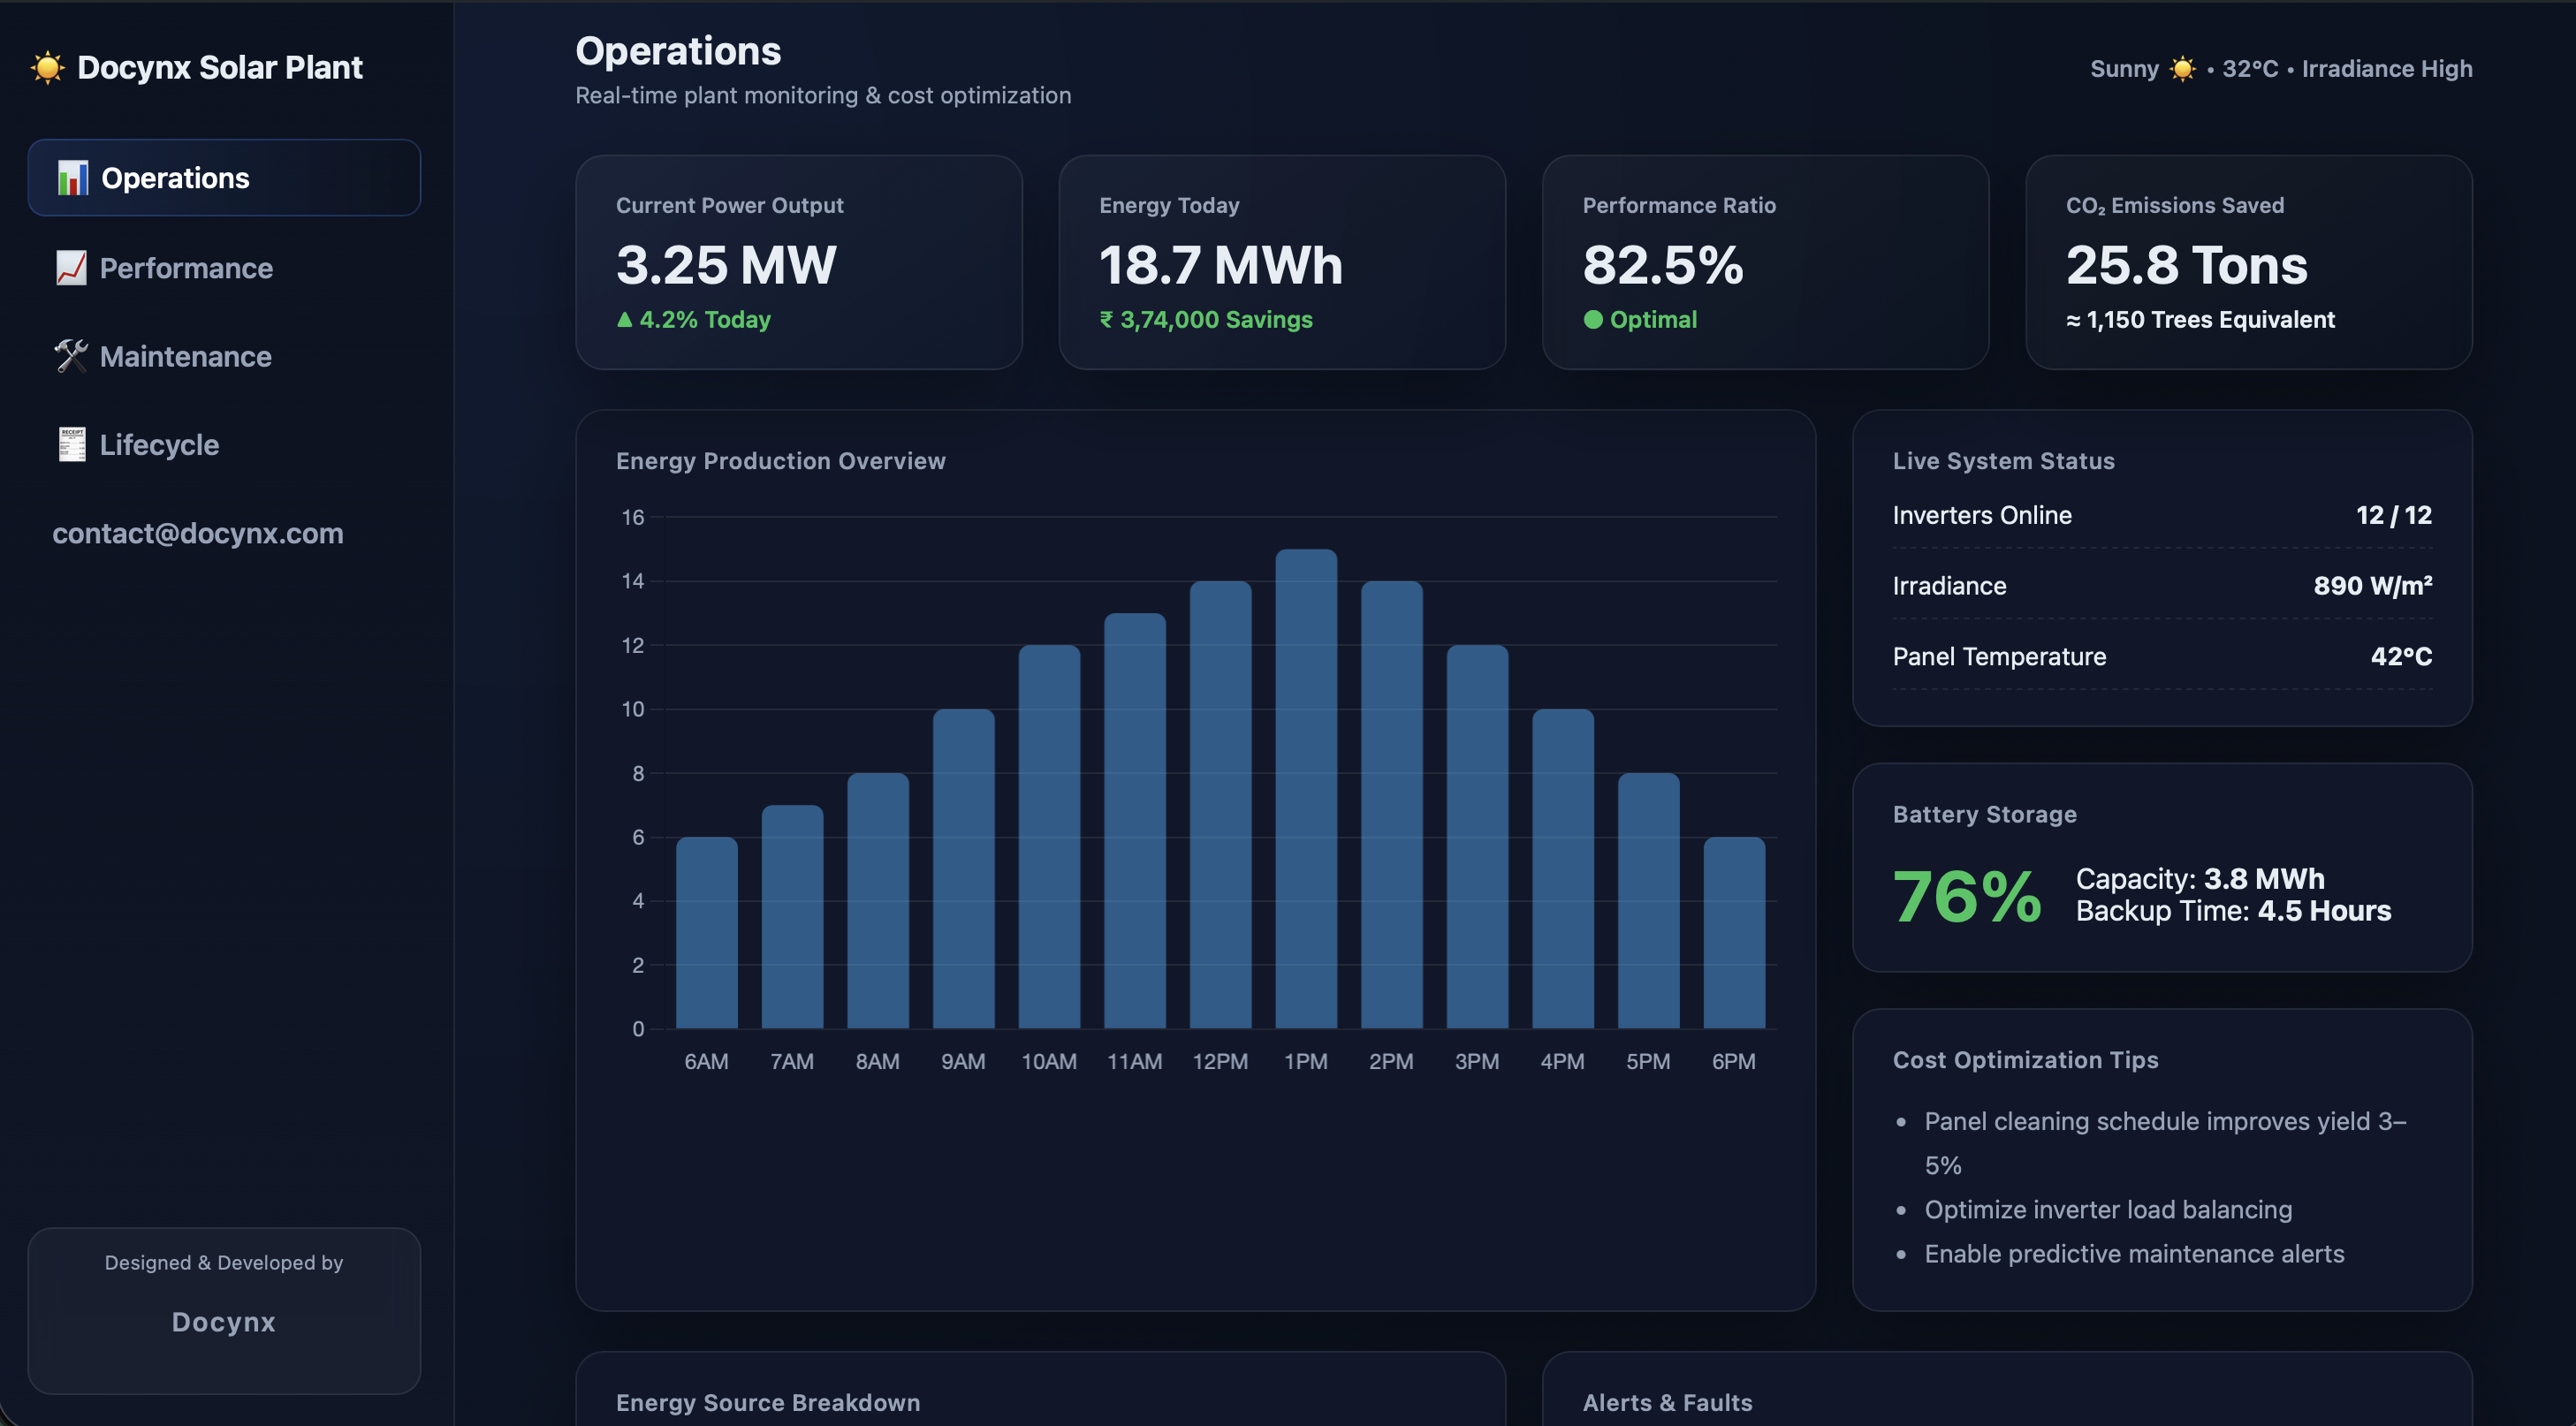
Solar Energy Analytics Dashboard
Track solar plant performance, energy generation trends, inverter efficiency, downtime analysis, and operational KPIs in one interactive dashboard.
View Dashboard →The dashboard above is a live demo. Change a status, resolve a blocker or move the reporting date, and every KPI, chart and list updates together. I build the same kind of reporting for your own data, in Power BI, Excel or the web.
No. All figures and names are illustrative sample data created for this demo.
Yes. Colours, logo, fonts and layout can be matched to your brand.
Yes. I won't use client data in public demos or portfolios without your written permission.
Most dashboards take one to three weeks, depending on how many data sources are involved and how many review rounds you need.
Not for the Excel and web versions. Power BI projects need Power BI licences for the people who view the reports, which I'll confirm with you up front.
Send me a short description and a sample of your data, and I'll reply with an approach and a fixed-price quote.
Interactive business intelligence dashboards built by Docynx. Explore real-world analytics and business insights.
Visit Gallery →
Track solar plant performance, energy generation trends, inverter efficiency, downtime analysis, and operational KPIs in one interactive dashboard.
View Dashboard →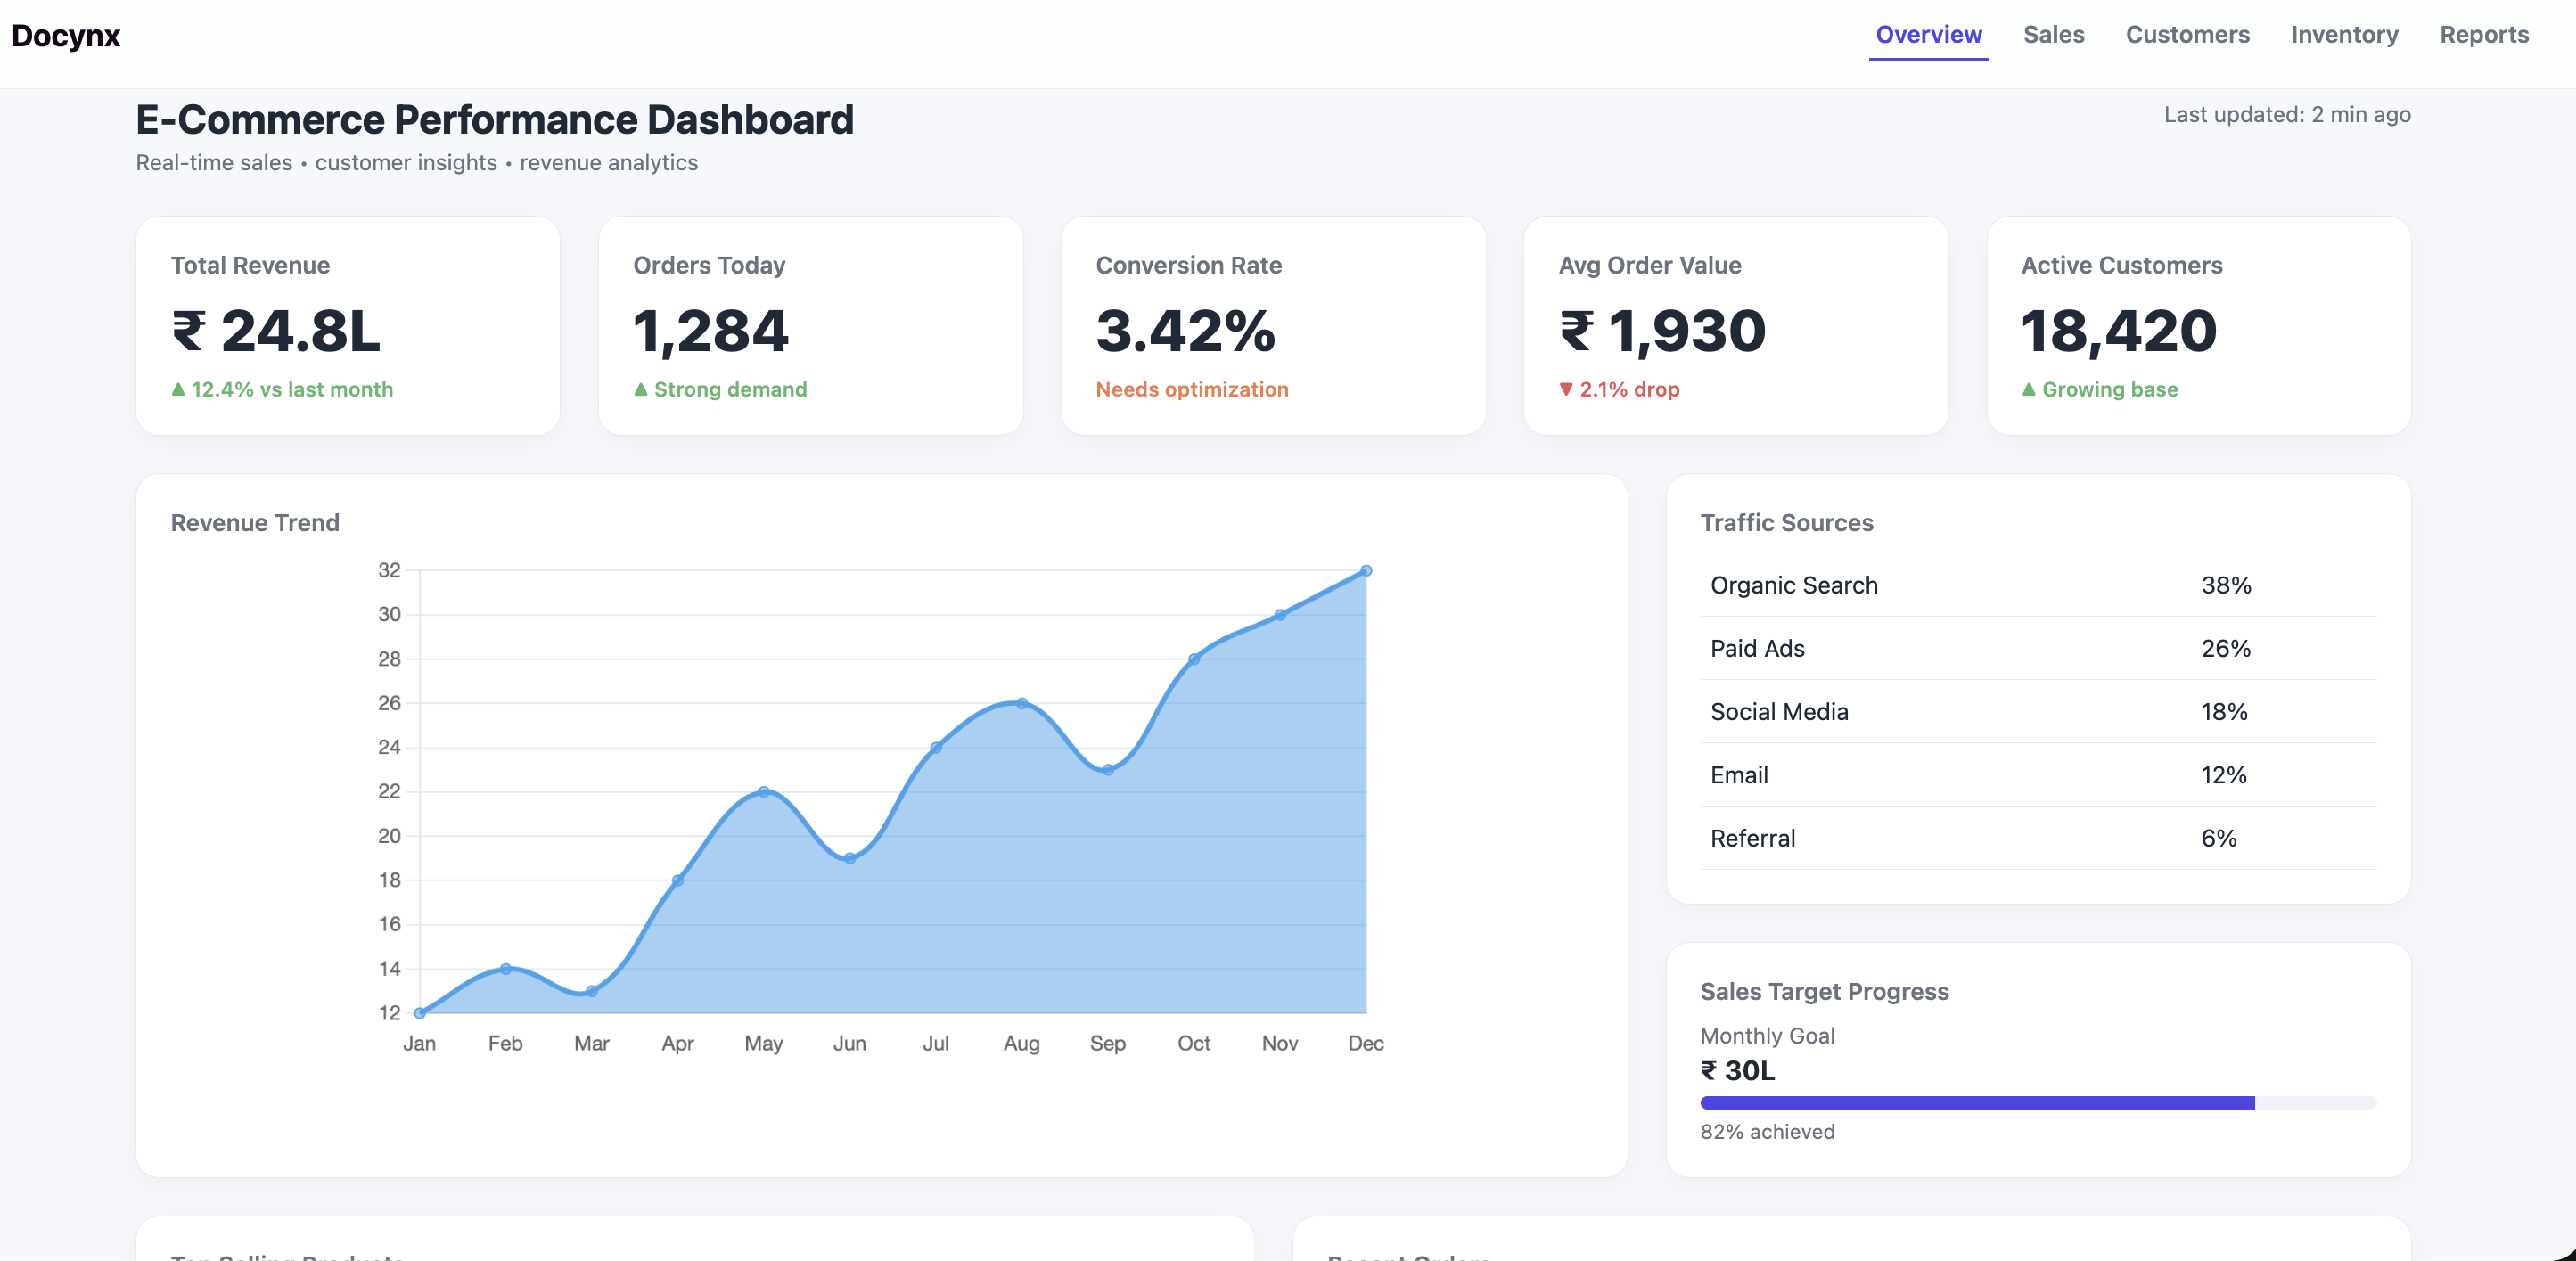
Analyze sales performance, customer insights, inventory tracking, revenue trends, and business reports.
View Dashboard →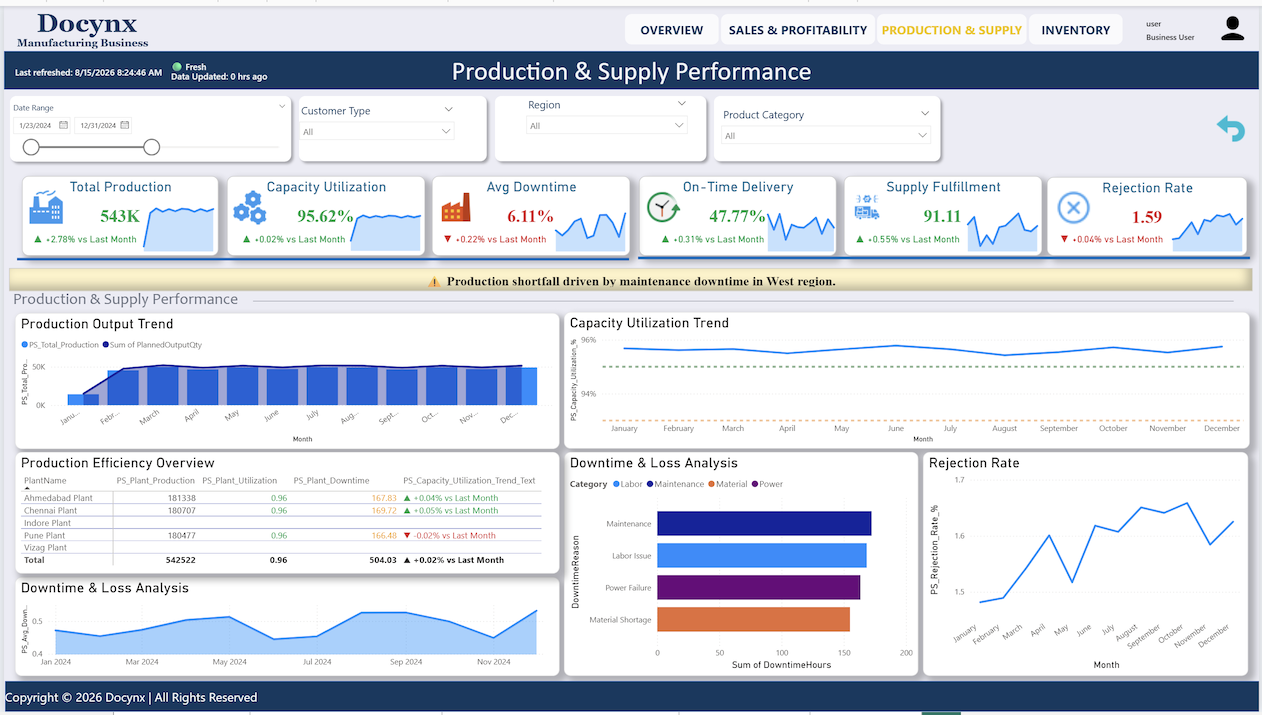
Explore customer health, revenue concentration, production output, capacity utilization, and downtime analytics.
View Dashboard →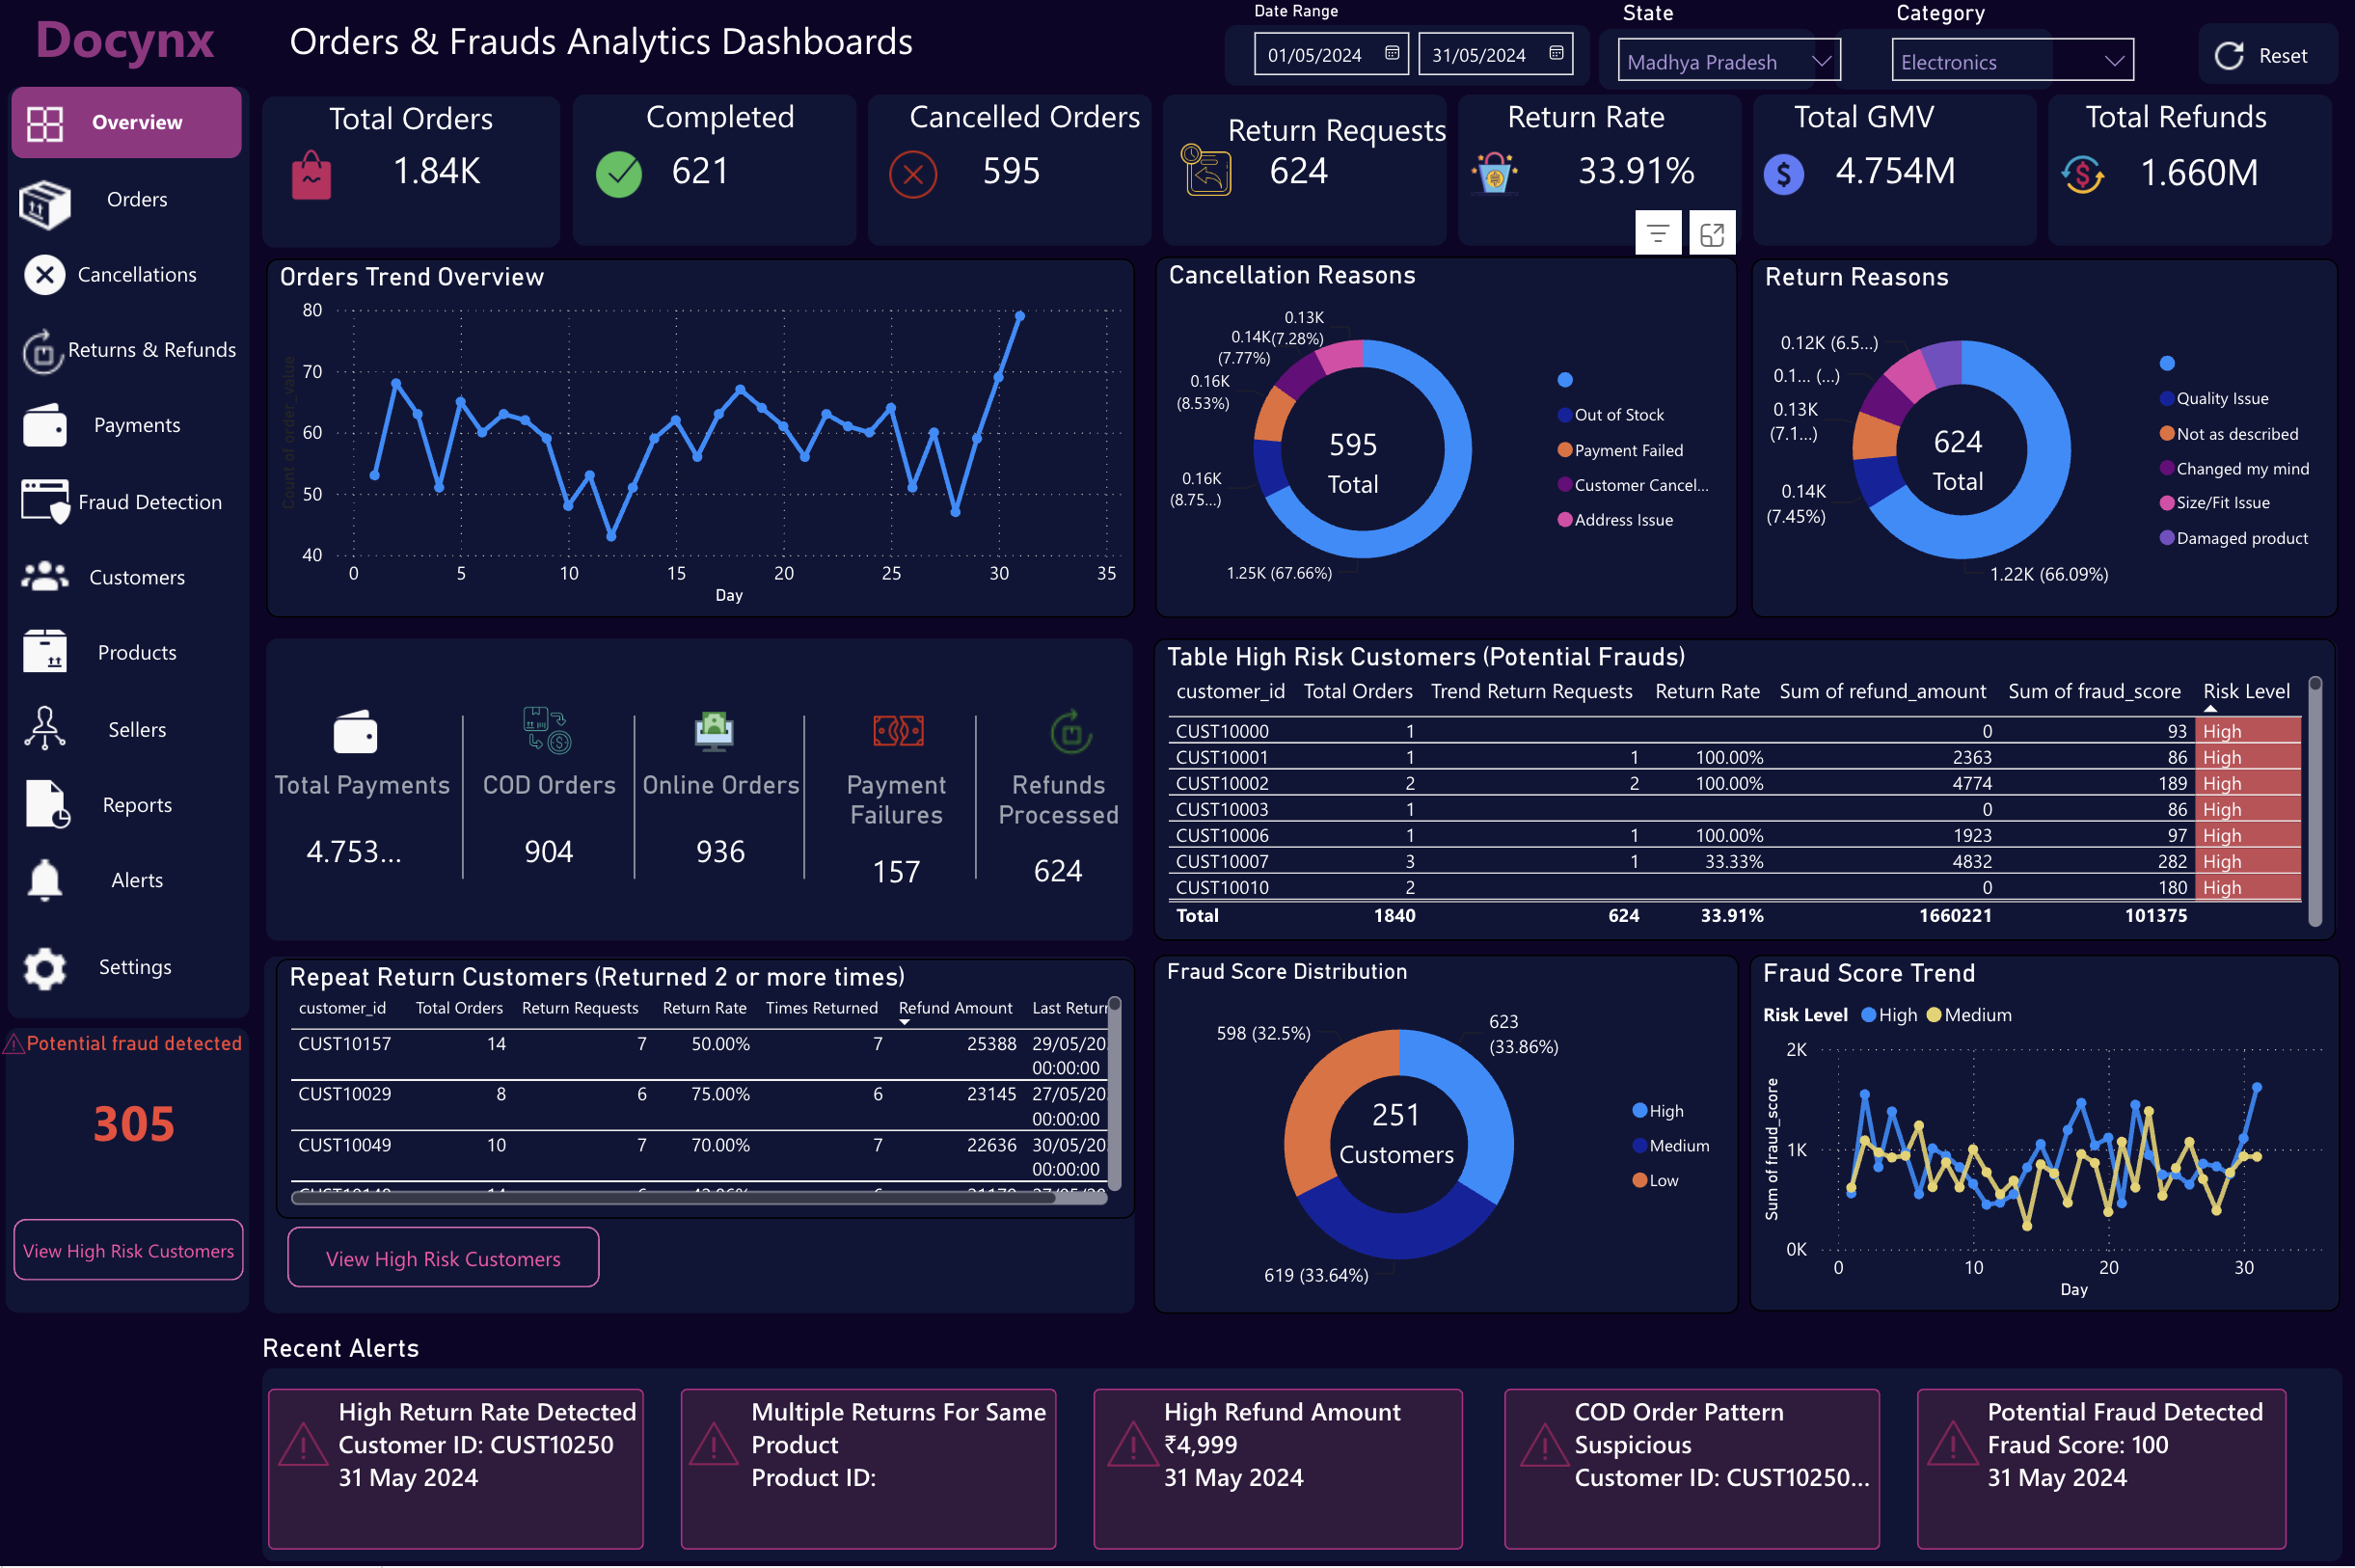
Monitor order lifecycle trends, cancellations, returns, payment behavior, customer analytics, and fraud risks through an interactive Power BI dashboard.
View Dashboard →