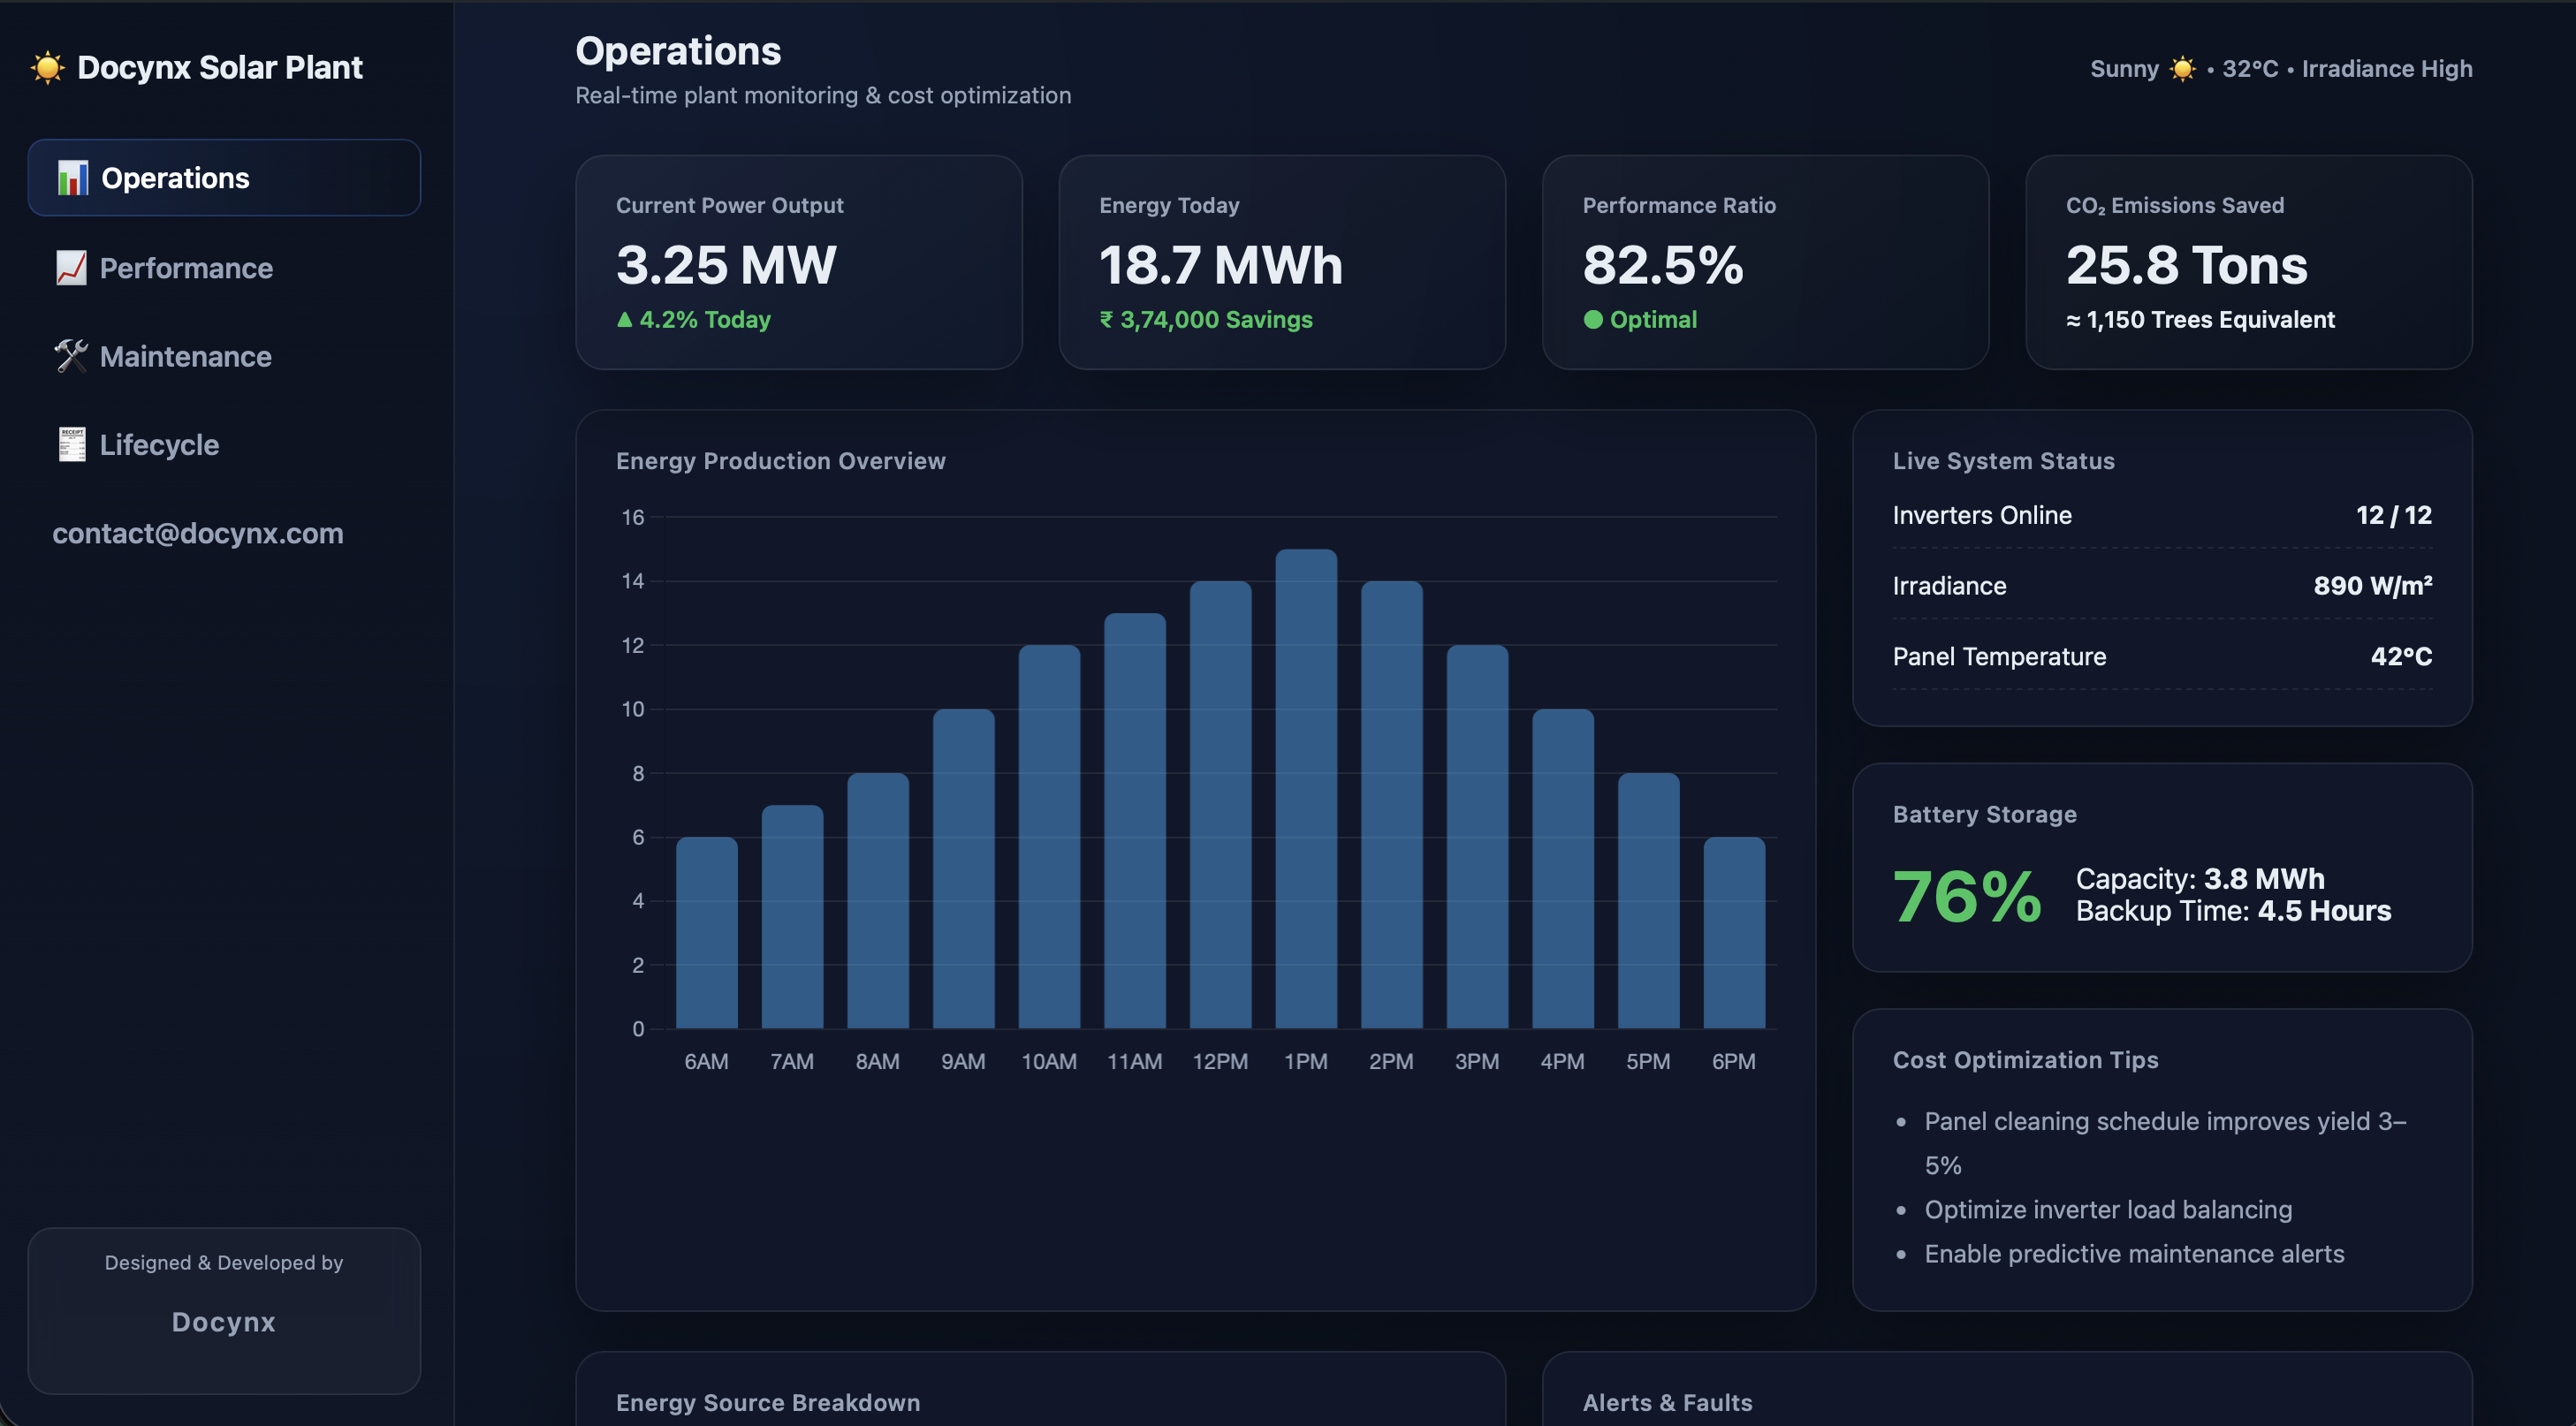
ENERGY ANALYTICS
Solar Energy Analytics Dashboard
Track solar plant performance, energy generation trends, inverter efficiency, downtime analysis, and operational KPIs in one interactive dashboard.
View Dashboard →| Source | Energy (MWh) | Share |
|---|---|---|
| Grid Import | 8.4 | 30% |
| Battery Usage | 30 | 45% |
| Direct Solar | 25 | 25% |
| Issue | Status | Priority |
|---|---|---|
| Inverter #3 Temperature High | Active | High |
| String 4 Low Performance | Monitoring | Medium |
| Maintenance Due | Scheduled | Low |
| Date | Gen (MWh) | PR | Variance | Status |
|---|---|---|---|---|
| 19 Mar | 14.2 | 83% | +2.1% | Good |
| 18 Mar | 13.8 | 81% | -1.4% | Watch |
| 17 Mar | 14.9 | 85% | +3.2% | Strong |
| Asset | Type | Last | Next | Status |
|---|---|---|---|---|
| Inverter INV-01 | Preventive | 12 Feb | 12 Apr | On Track |
| Inverter INV-04 | Inspection | 02 Jan | 25 Mar | Due Soon |
| Panel Array A | Cleaning | 18 Dec | 22 Mar | Overdue |
| Transformer TR-02 | Thermal Scan | 05 Mar | 05 Jun | Scheduled |
| WO ID | Asset | Issue | Priority | Assigned | Status |
|---|---|---|---|---|---|
| WO-7842 | INV-04 | Overheating | High | R. Sharma | In Progress |
| WO-7848 | Panel A | Soiling Loss | Medium | A. Patel | Scheduled |
| WO-7851 | Battery Bank 2 | Capacity Drop | Medium | S. Iyer | Diagnosing |
| WO-7859 | Transformer TR-02 | Oil Level Low | High | M. Khan | Pending Parts |
| Asset | Category | Installed | Age | Health | Lifecycle | Action |
|---|---|---|---|---|---|---|
| INV-01 | Inverter | 2019 | 7 yrs | 92% | Prime | Monitor |
| INV-04 | Inverter | 2016 | 10 yrs | 74% | Aging | Service Plan |
| TR-02 | Transformer | 2014 | 12 yrs | 61% | End of Life | Replace FY27 |
| Battery Bank 2 | Storage | 2021 | 5 yrs | 88% | Early | Normal |
Vendor selection • CapEx approval • Commissioning
Warranty phase • Performance validation
Peak efficiency • Lowest failure rates
Rising maintenance • Efficiency drop
Refurbish • Repower • Replace
Interactive business intelligence dashboards built by Docynx. Explore real-world analytics and business insights.
Visit Gallery →
Track solar plant performance, energy generation trends, inverter efficiency, downtime analysis, and operational KPIs in one interactive dashboard.
View Dashboard →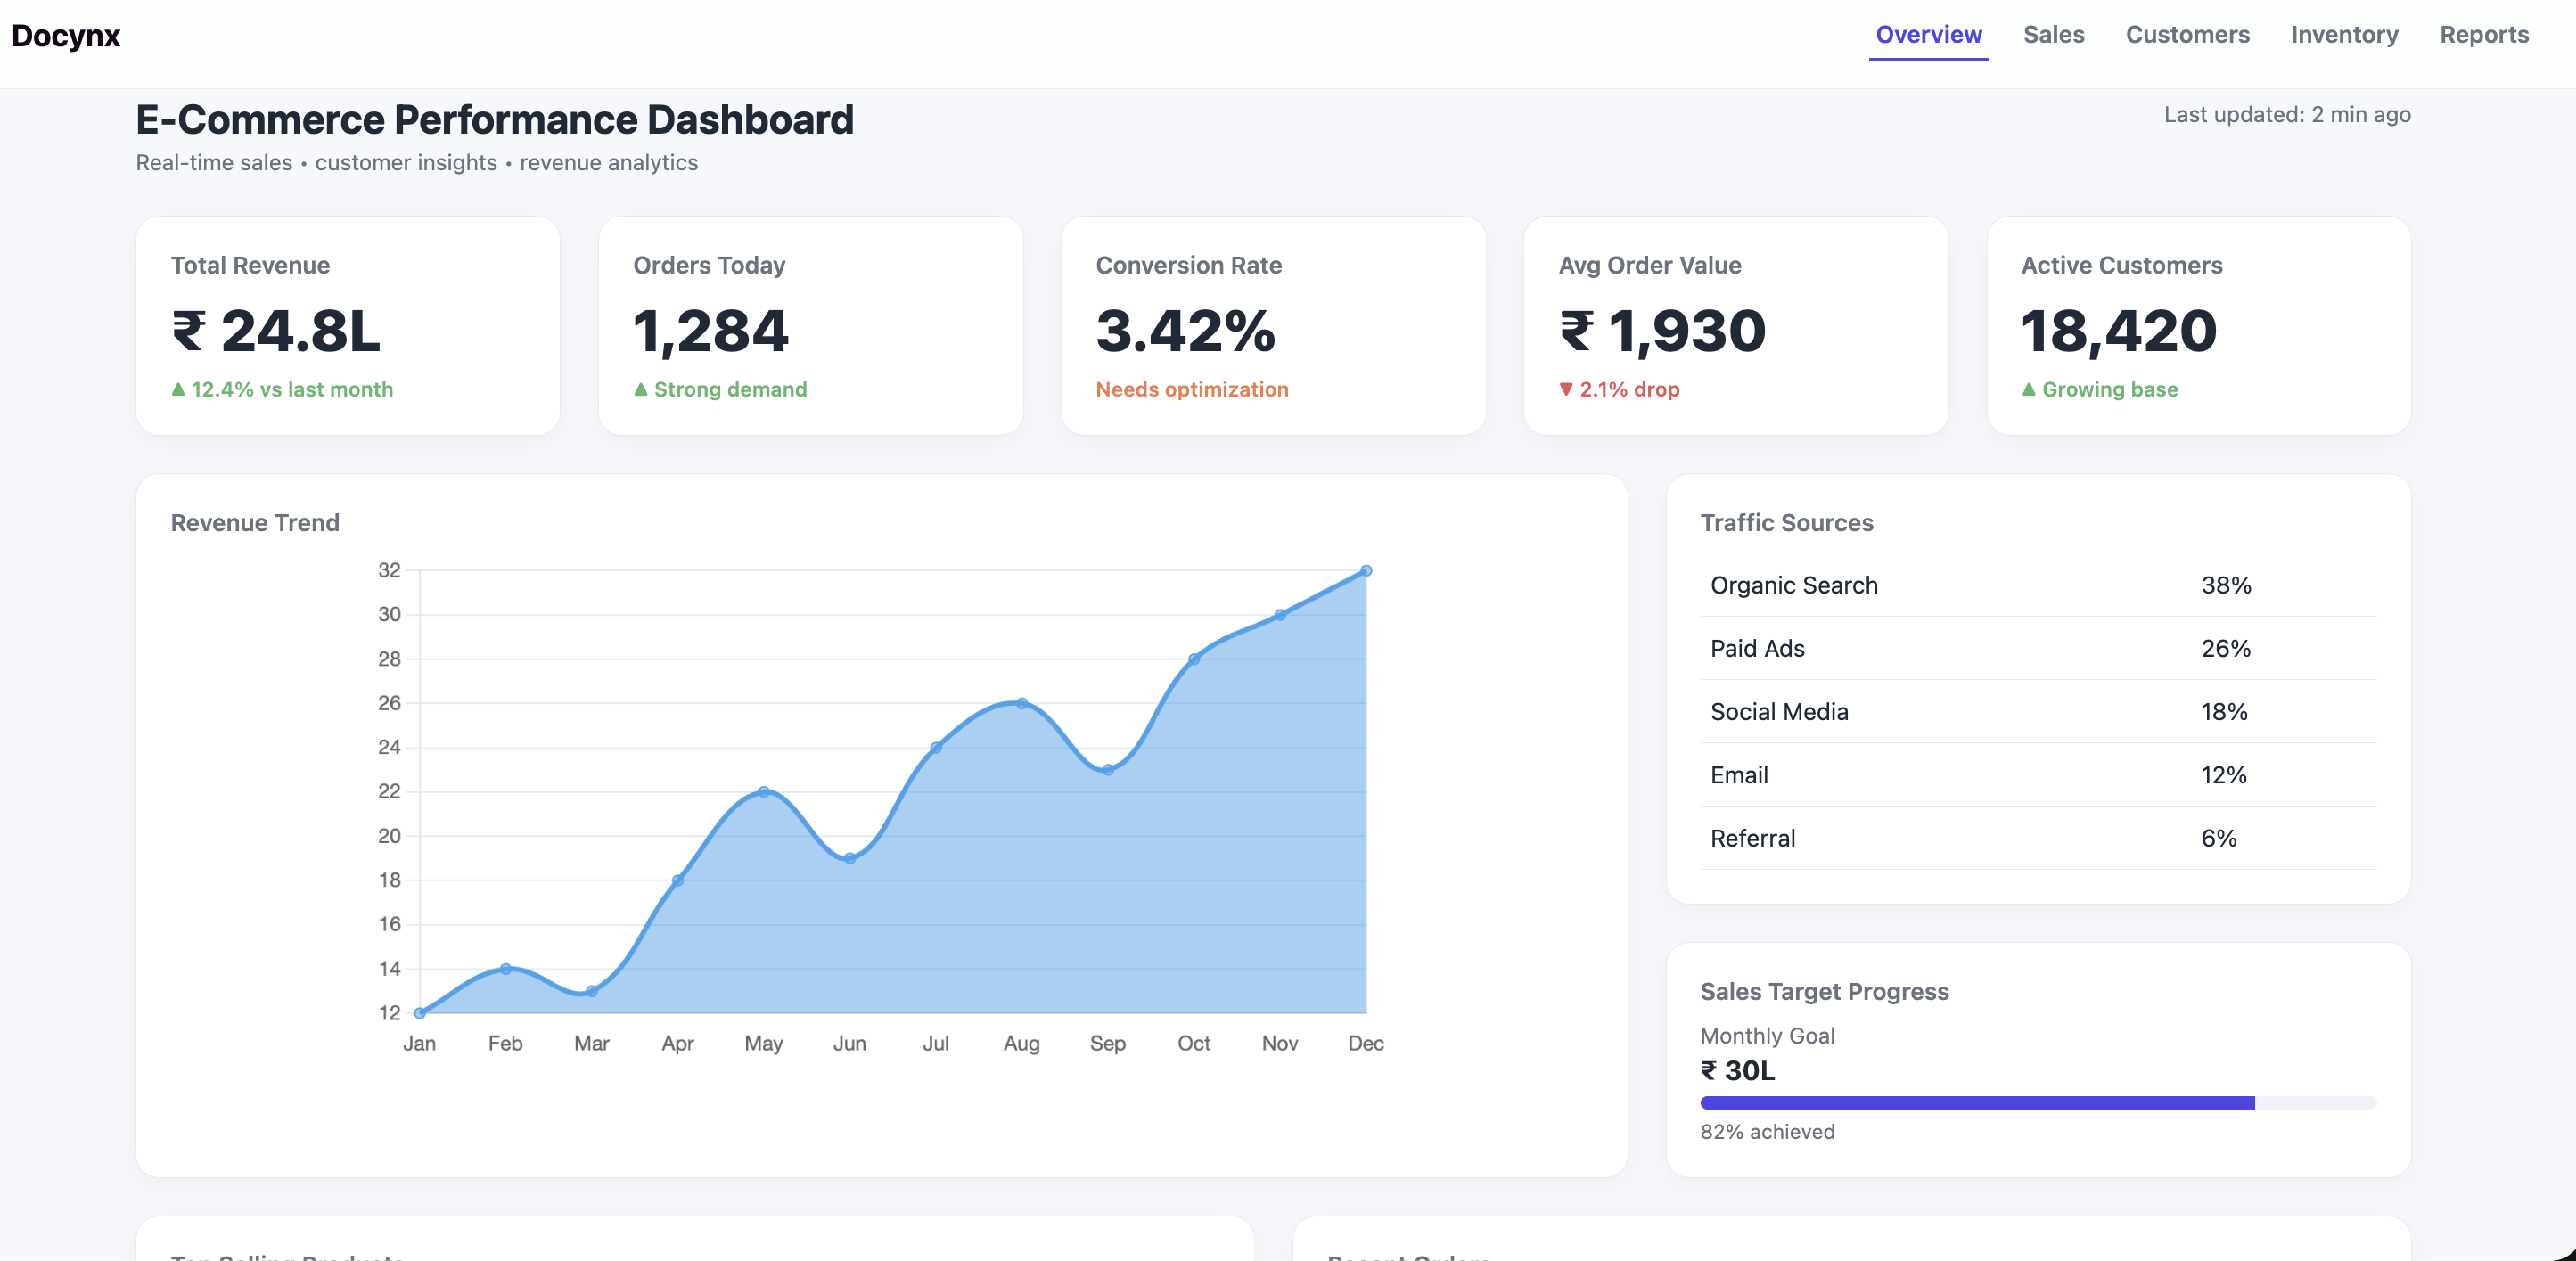
Analyze sales performance, customer insights, inventory tracking, revenue trends, and business reports.
View Dashboard →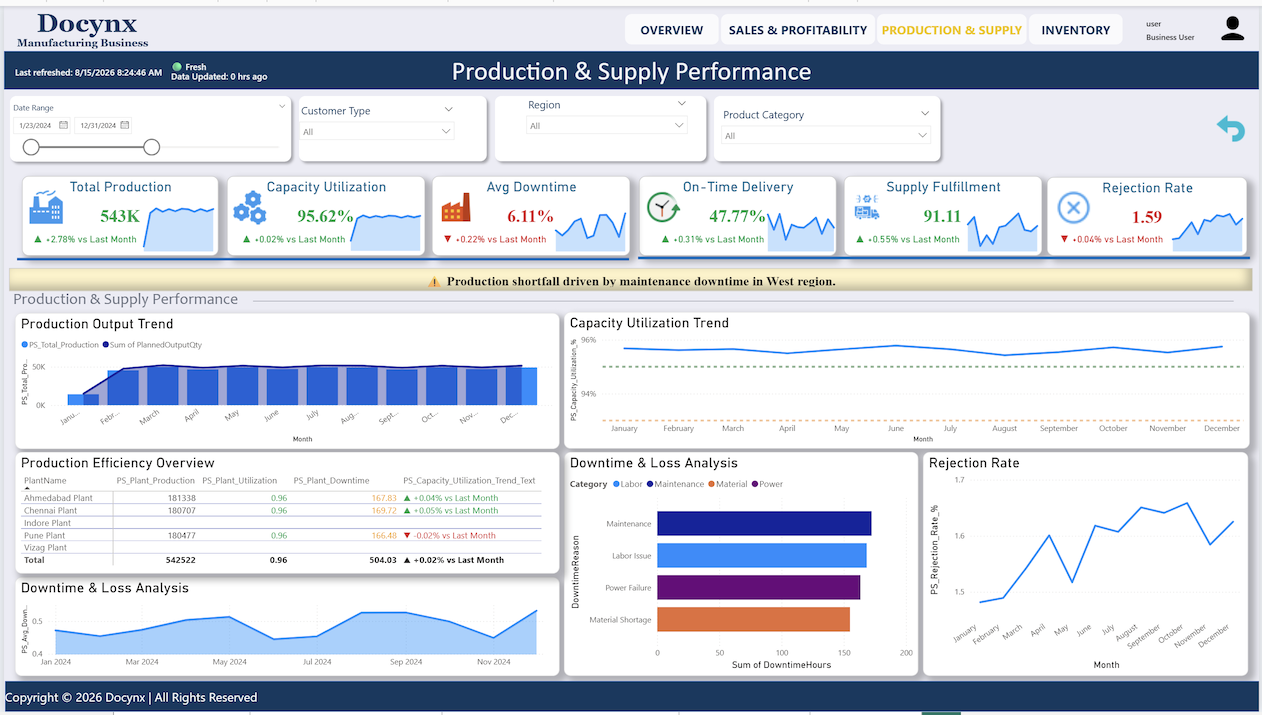
Explore customer health, revenue concentration, production output, capacity utilization, and downtime analytics.
View Dashboard →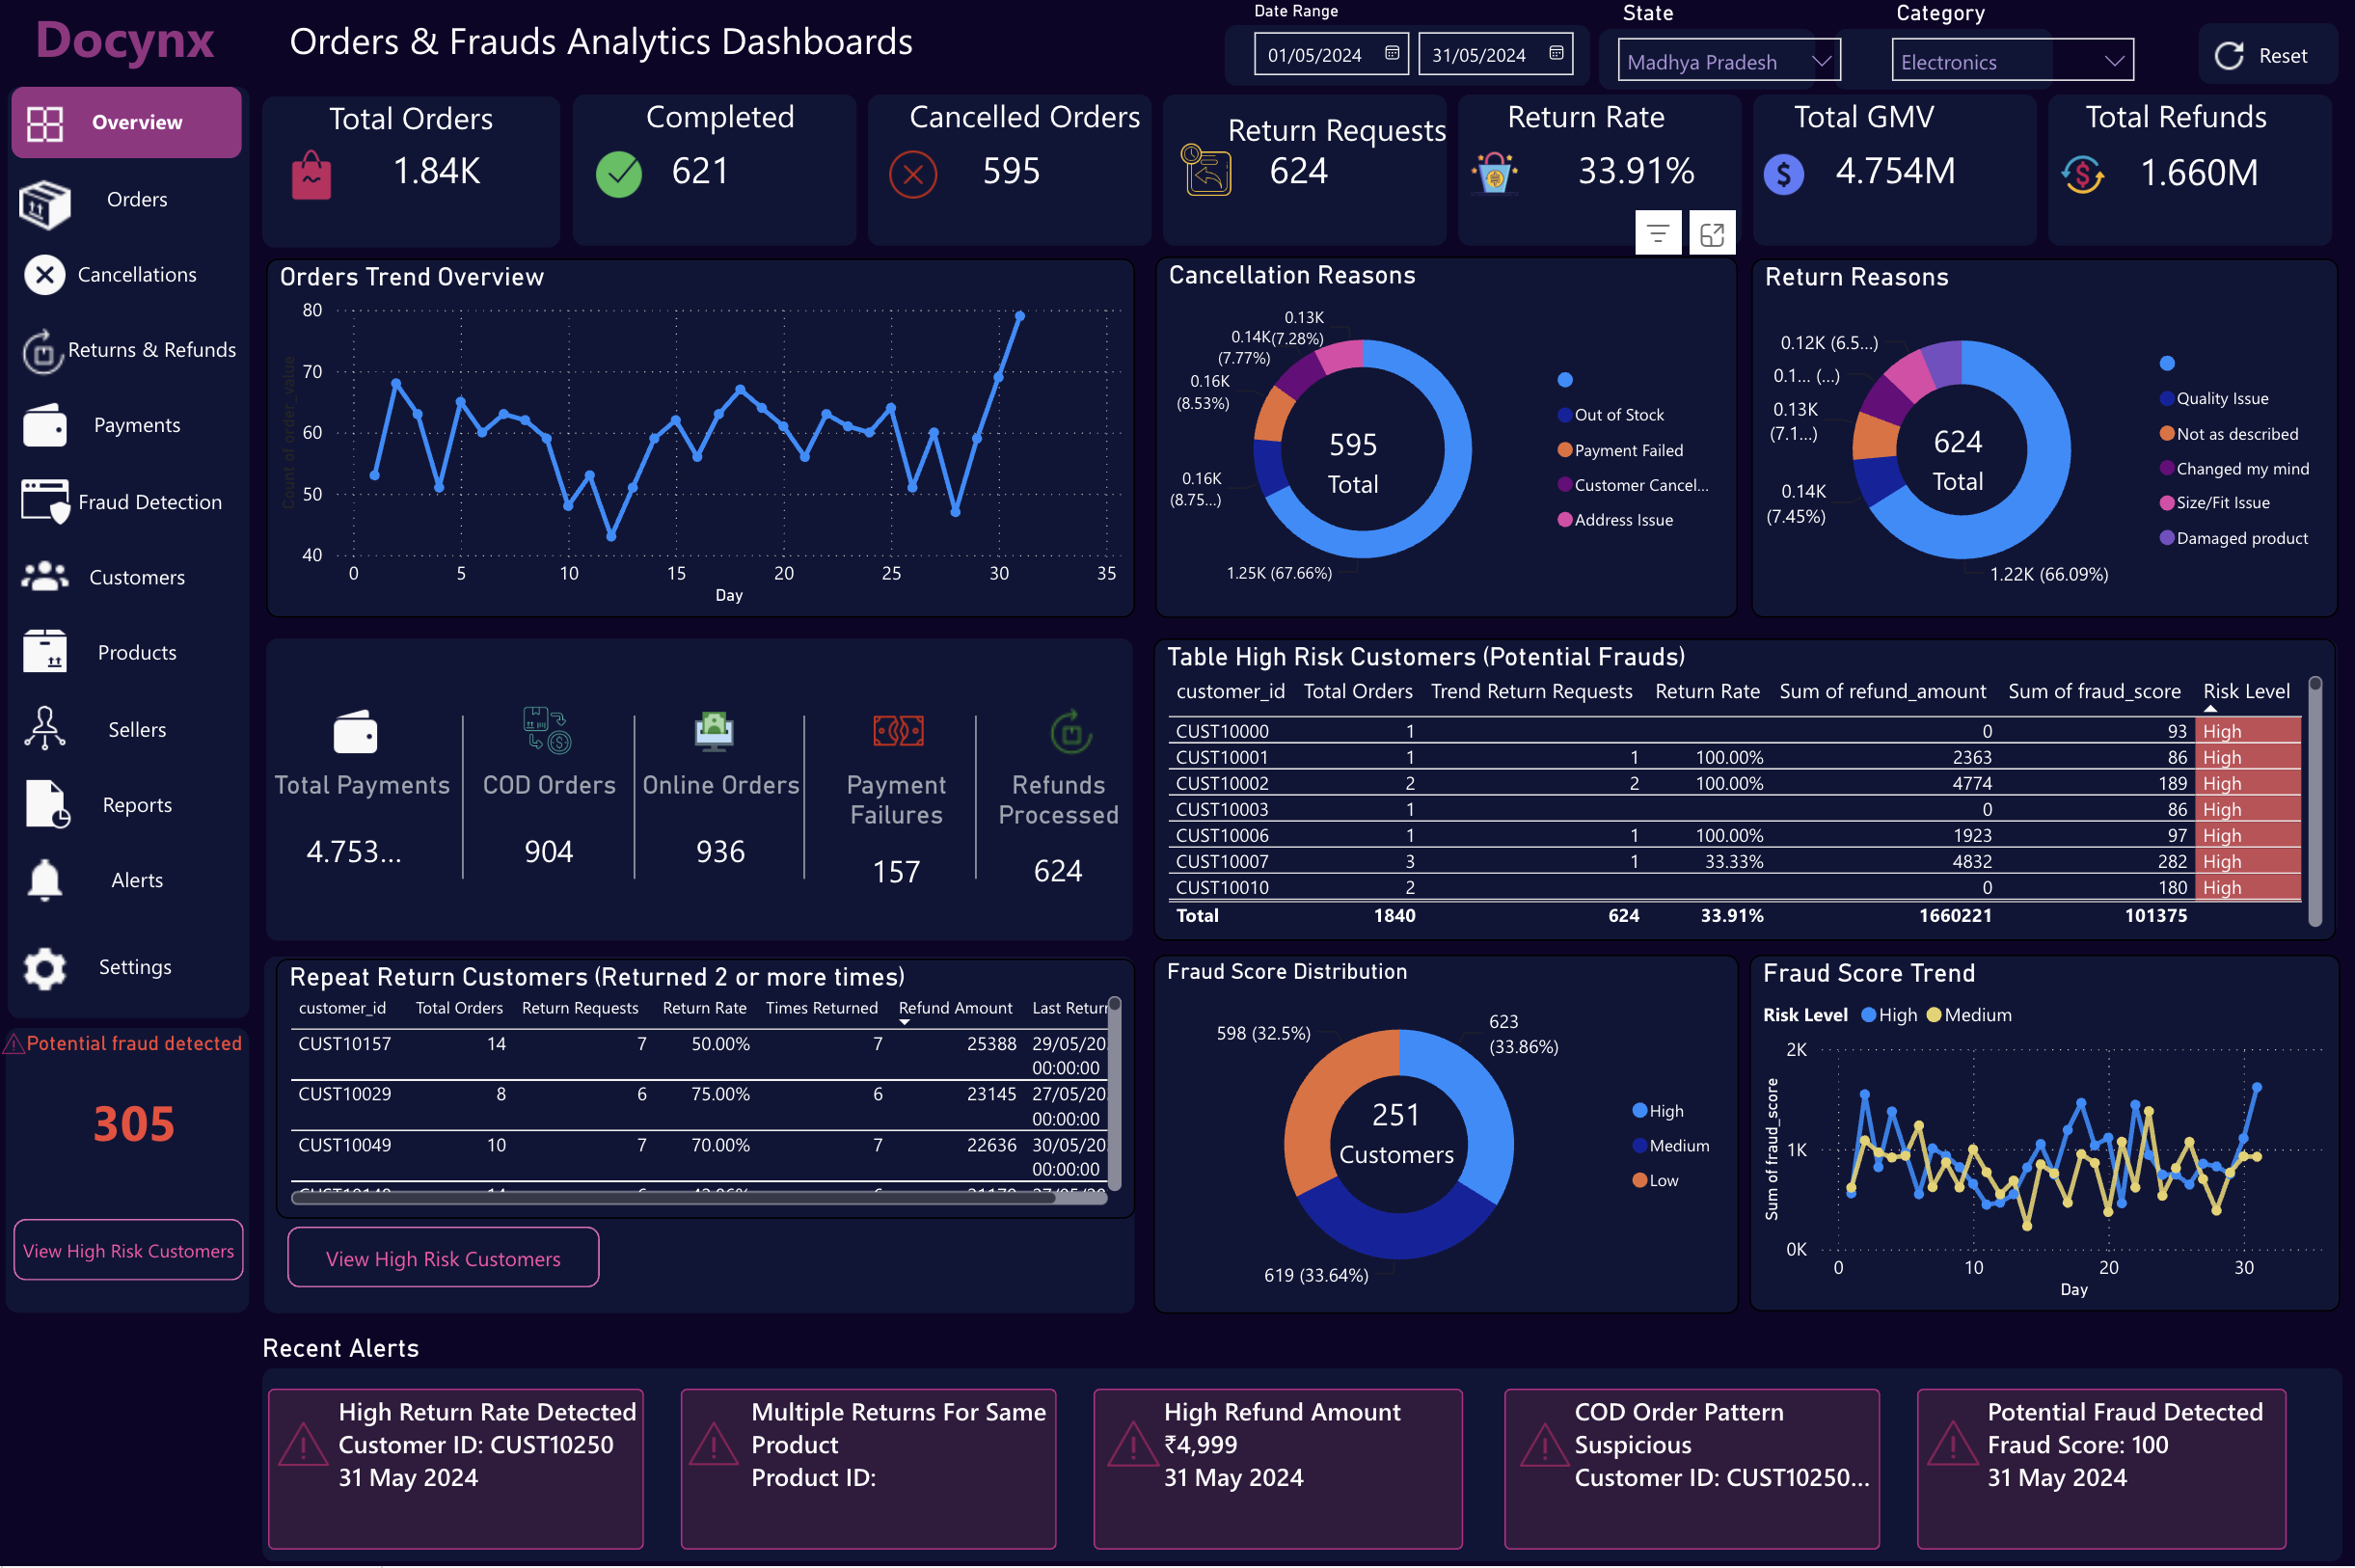
Monitor order lifecycle trends, cancellations, returns, payment behavior, customer analytics, and fraud risks through an interactive Power BI dashboard.
View Dashboard →