Insurance Analytics Dashboard for Power BI: Premium, Claims and Profitability
Insurance leaders ask the same questions every month. Is premium growing as planned? Which lines are profitable? Where are claims getting more expensive? Which agencies bring in business that pays off? Answering them usually means stitching together policy, claims and finance extracts by hand.
This dashboard answers them on one data model. It has five report pages, a realistic insurance star schema and more than 120 ready-made measures, and it ships with sample data for a fictional carrier so you can explore it straight away. When you are ready, you connect your own policy, claims and finance data to the same model.
What is inside
1. Executive summary
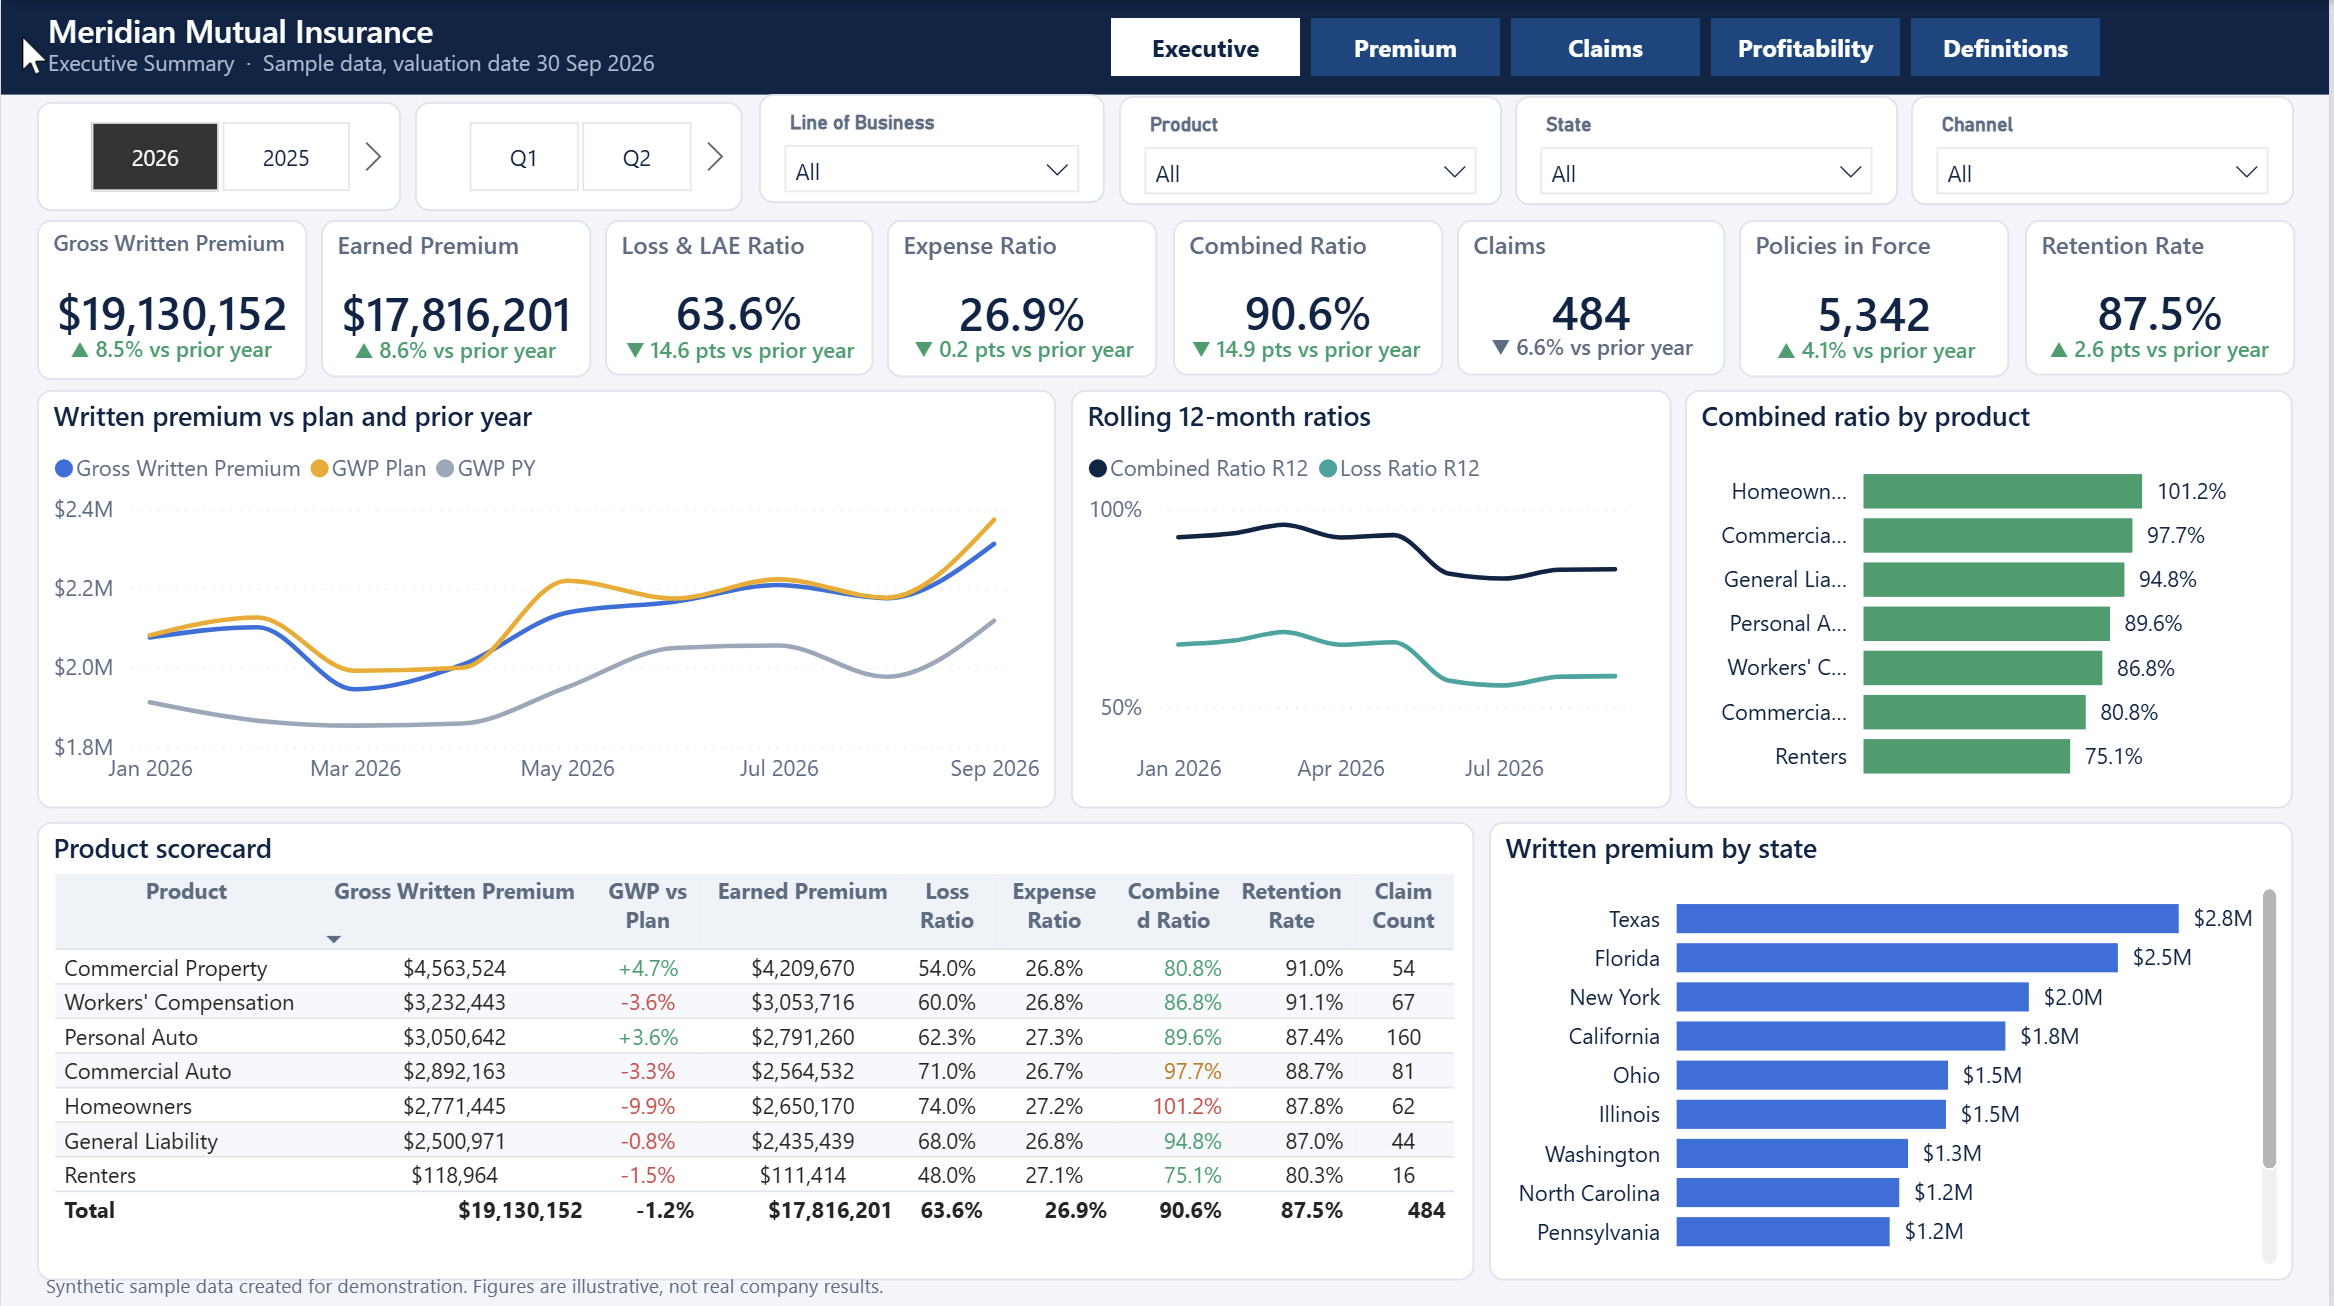
The first page is built for a leadership review. Eight headline cards show gross written premium, earned premium, the loss and expense ratios, the combined ratio, claim count, policies in force and retention, each with a comparison to the prior year. Below them you see written premium against plan and prior year, rolling 12-month loss and combined ratios, the combined ratio by product, a product scorecard and written premium by state.
2. Premium and growth
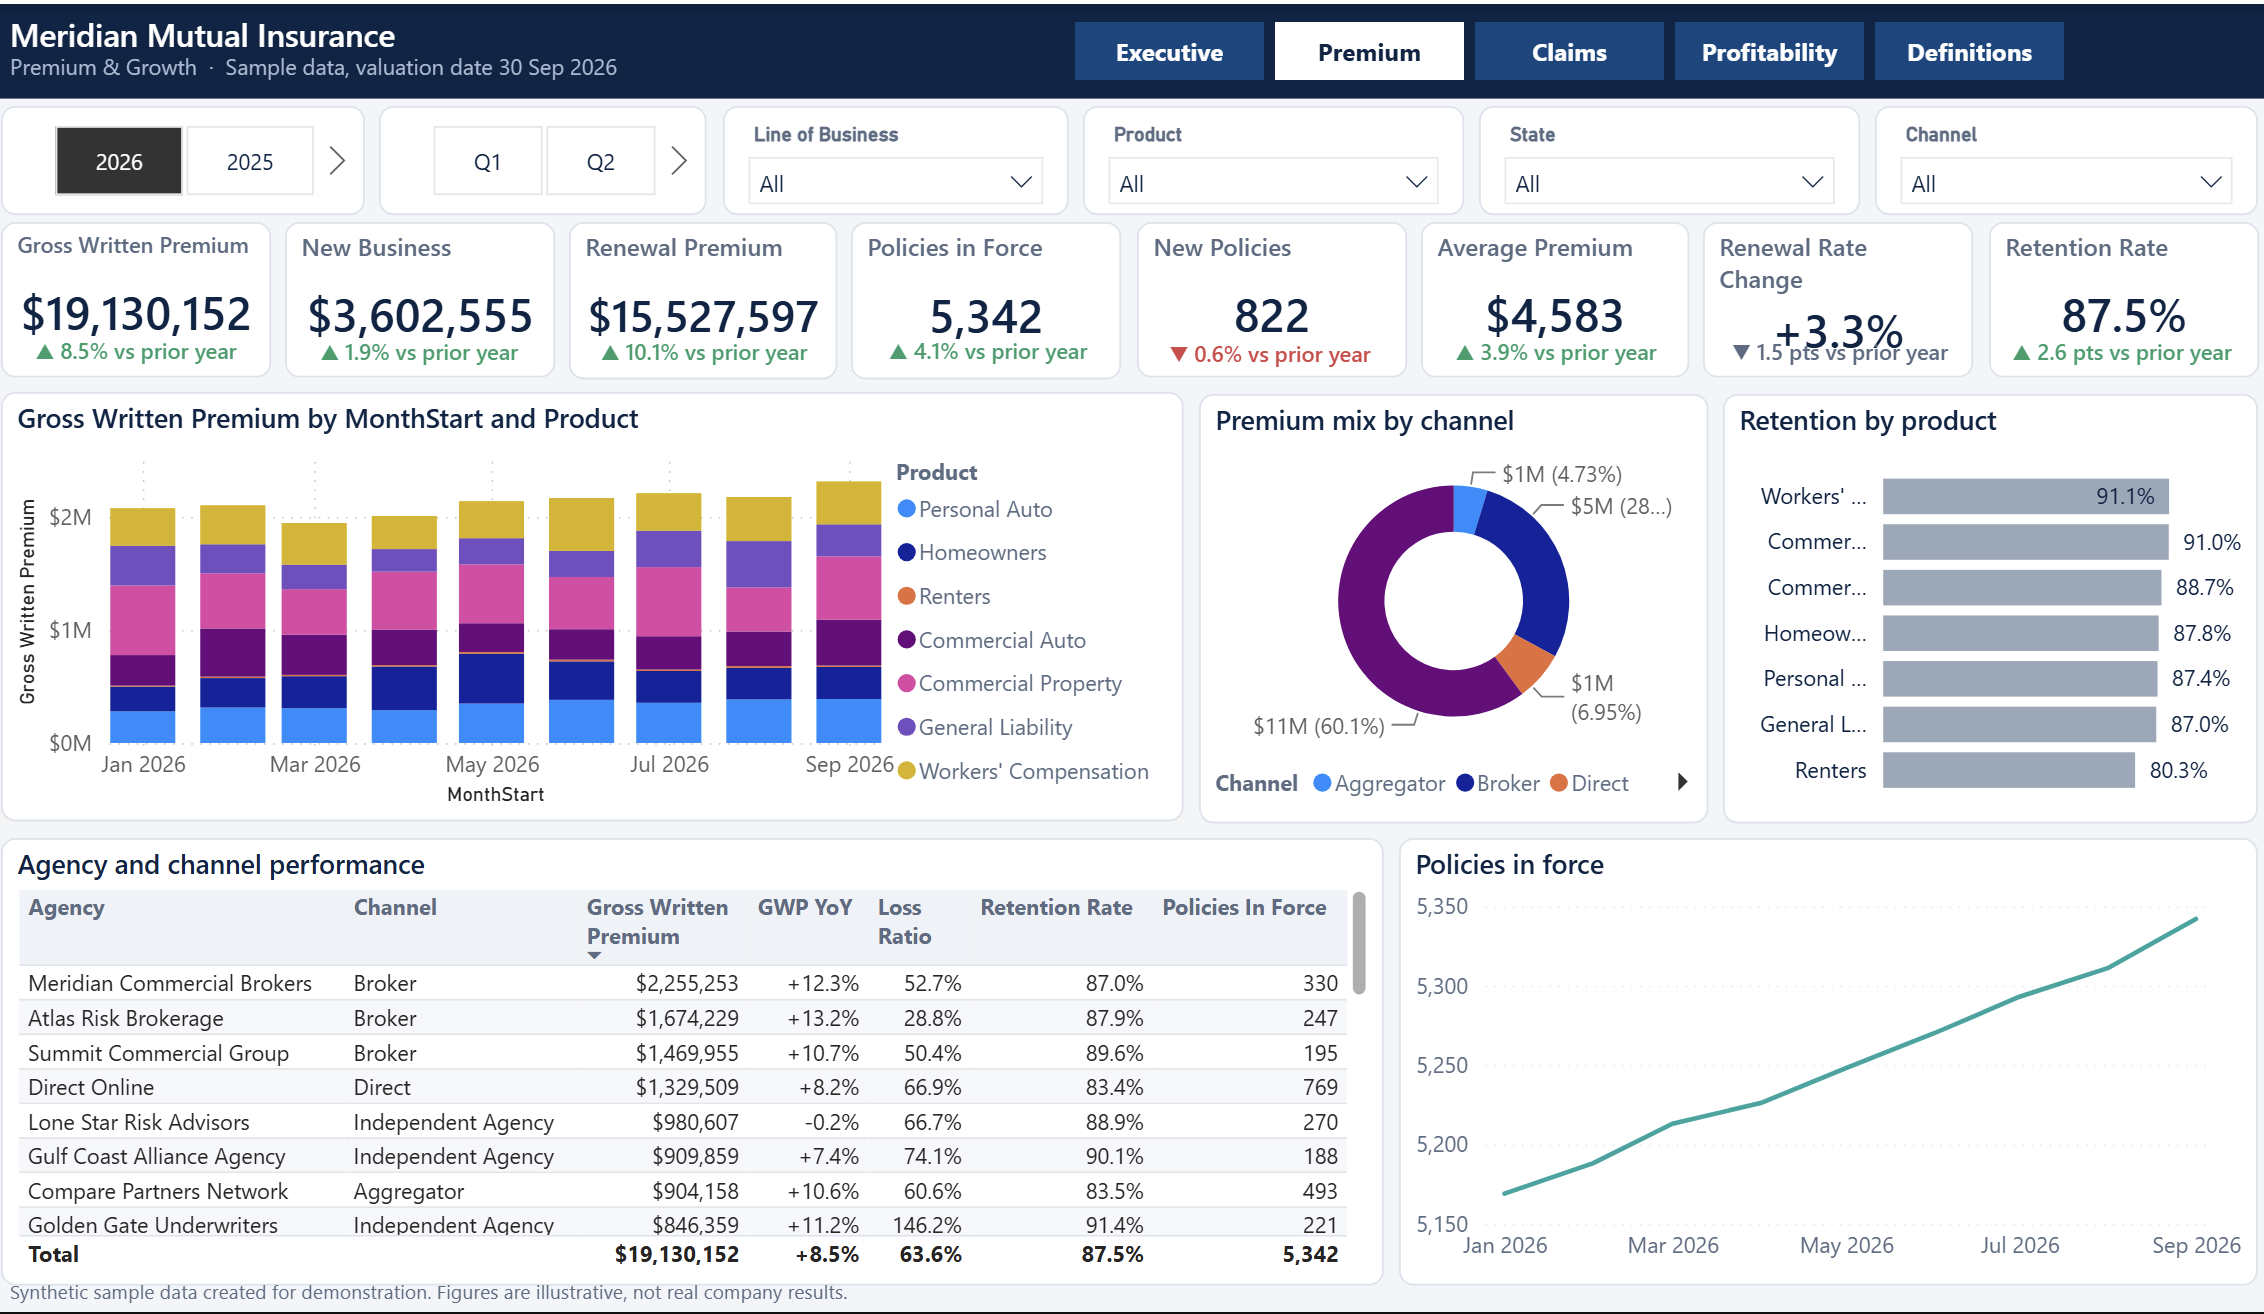
This page explains where growth comes from. It splits written premium into new business and renewals, tracks policies in force and new policies, and shows average premium and the rate change achieved on renewals. A stacked chart shows premium by product over time, a donut shows the channel mix, and an agency table ranks distribution partners by premium, growth, loss ratio, retention and policies in force.
3. Claims
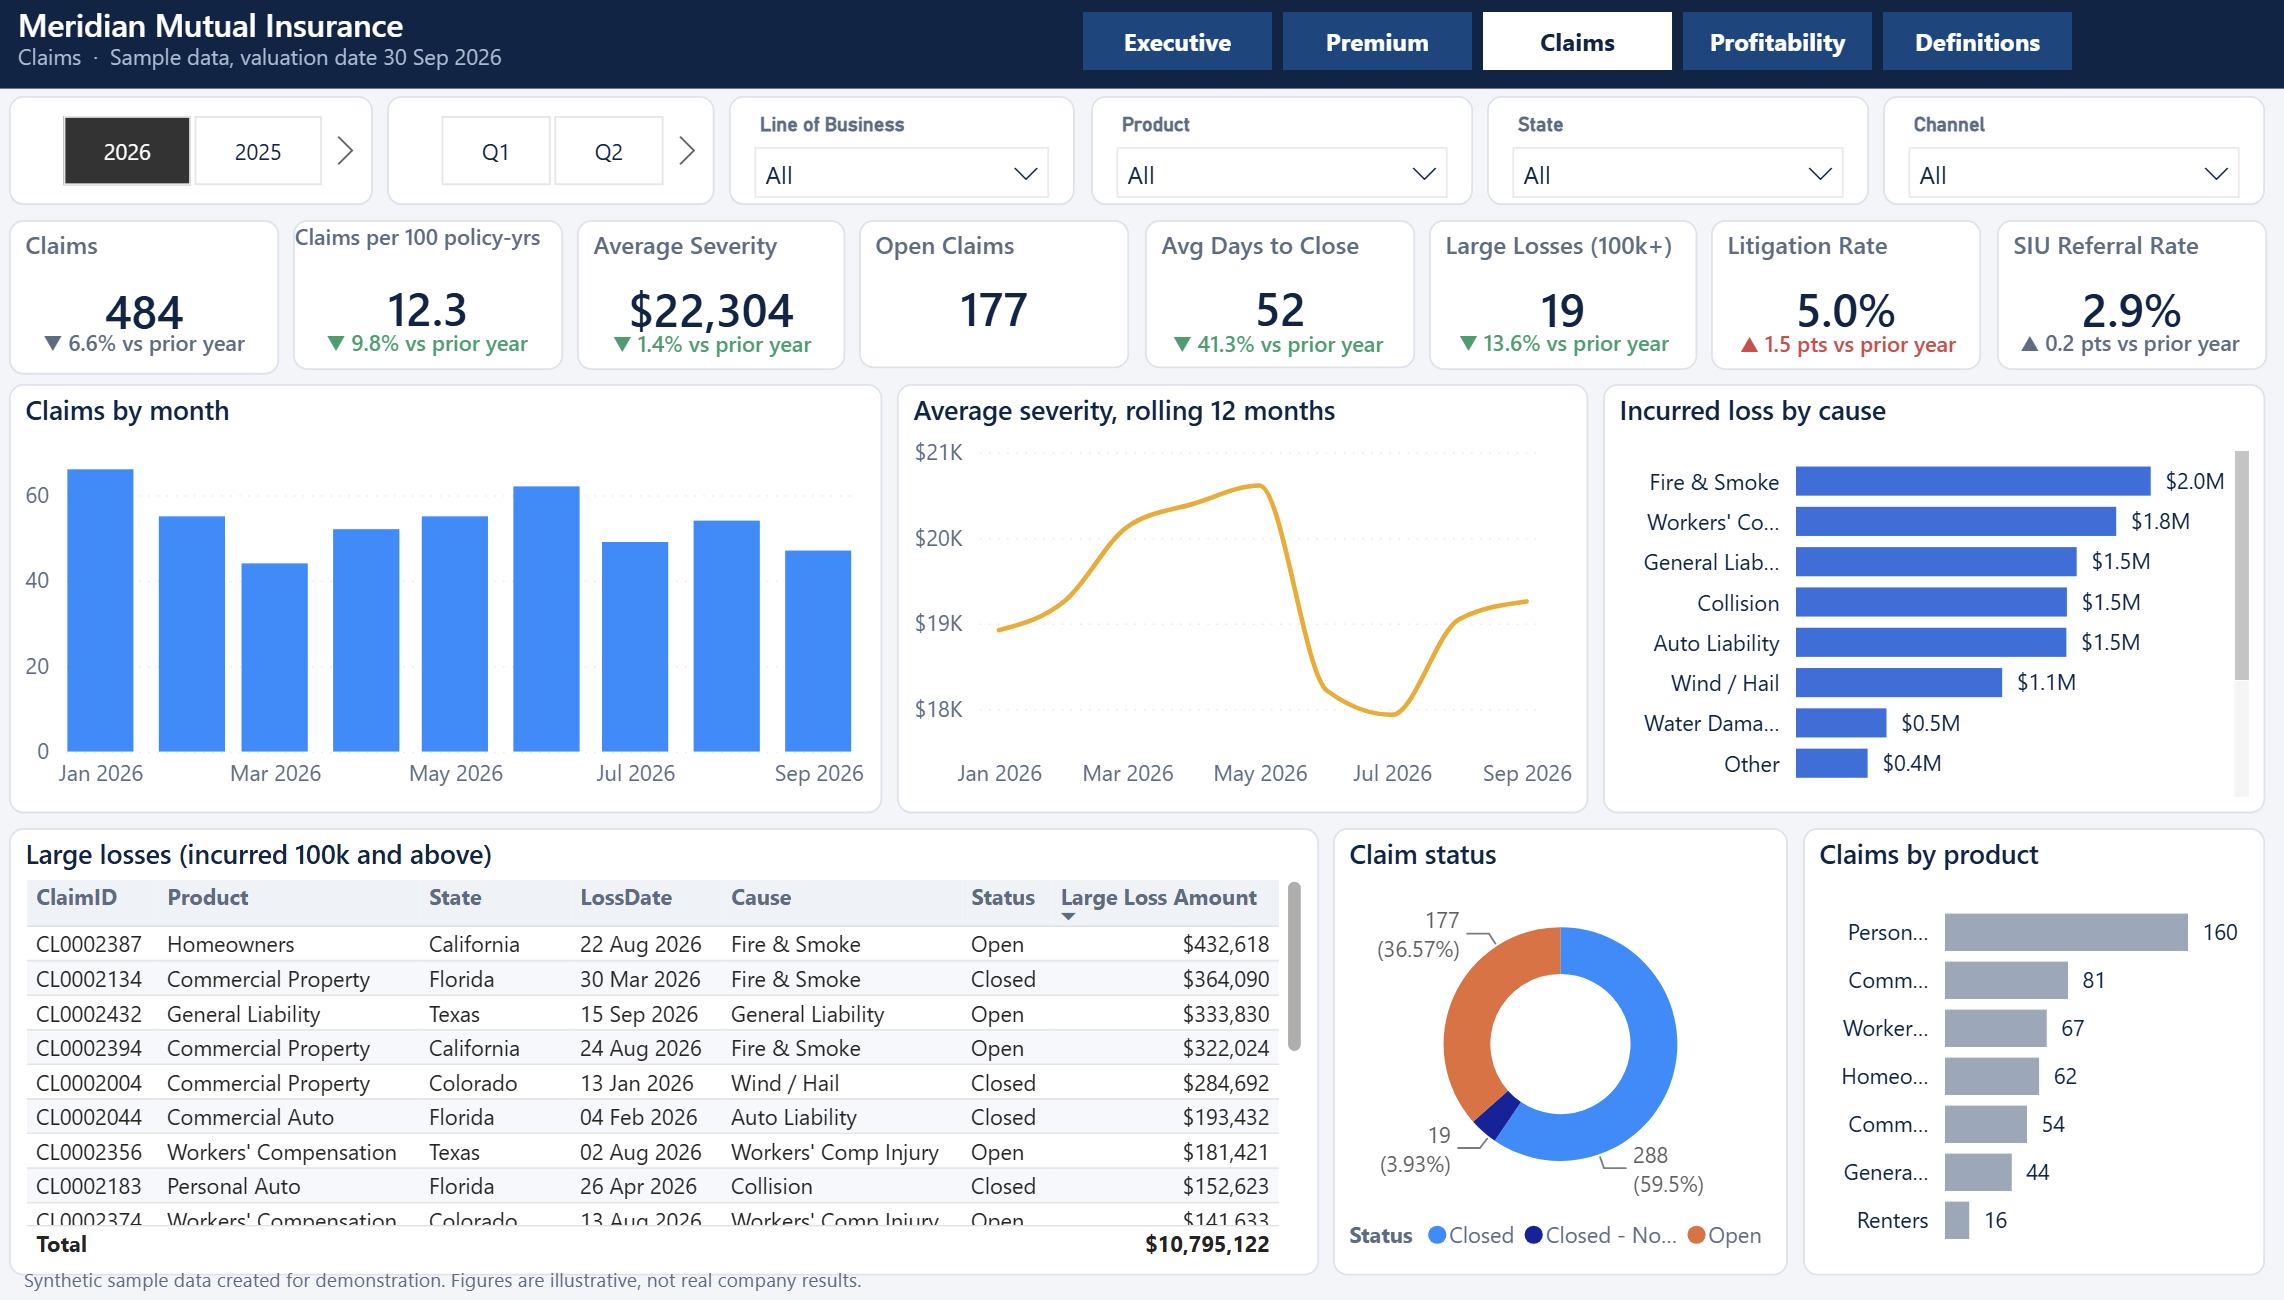
The claims page tracks claim count, frequency per 100 policy-years, average severity, open claims, days to close, large losses, litigation rate and special investigations referral rate. Charts show claims by month, severity on a rolling 12-month basis, incurred loss by cause and claim status, and a table lists the largest losses so you can spot them quickly.
4. Profitability
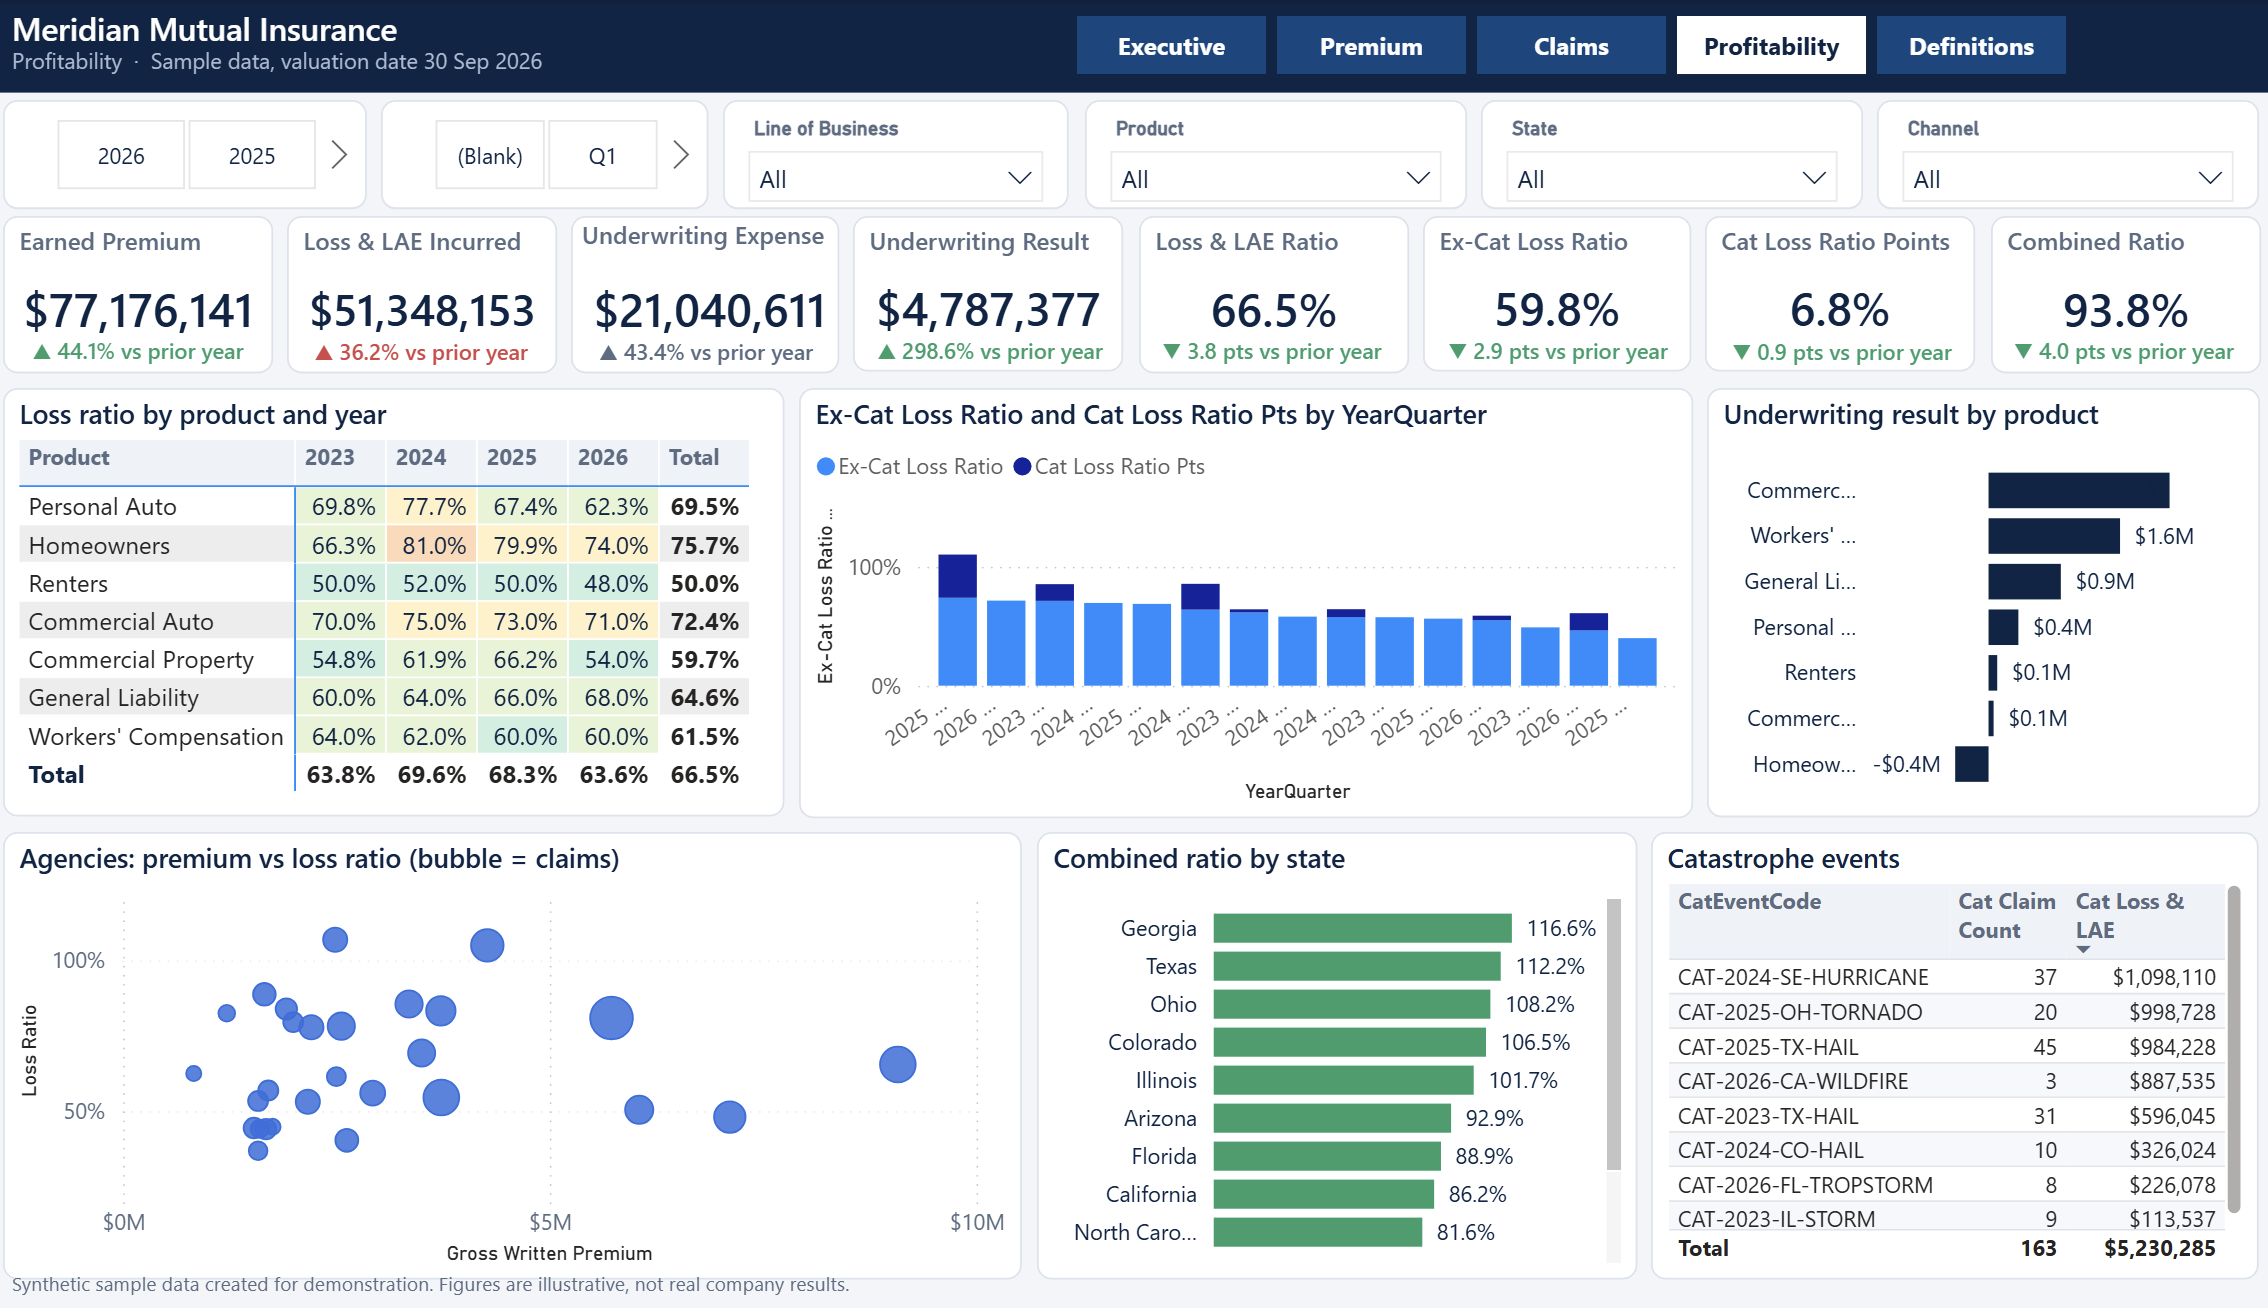
This page shows whether the book makes money. A heat-colored matrix shows the loss ratio by product and year, a stacked chart separates the ex-catastrophe loss ratio from catastrophe points, and a bar chart shows underwriting result by product. An agency scatter plots premium against loss ratio, a state chart ranks the combined ratio, and a table lists each catastrophe event with its claim count and loss.
5. Definitions and data notes
The last page defines every key measure in plain language, from earned premium to retention rate, and describes the data model. New users and stakeholders can see exactly how each number is calculated.
Every page has filters for year, quarter, line of business, product, state and channel, plus navigation buttons across the top.
A realistic data model
The report sits on a star schema that follows how insurance data is really organised. Claims link to the policy term they belong to, so every claim can be sliced by product, agency, state and customer.
| Table | Type | What it holds |
|---|---|---|
| FactPolicy | Fact | One row per policy term, new business and renewals, with premium, prior-term premium, rate change and renewal flags |
| FactClaim | Fact | One row per claim with paid loss, reserves, expense, recoveries, litigation, referral flags and catastrophe event code |
| FactPremiumMonthly | Fact | Written and earned premium, commission and operating expense, exposure and policies in force by month, product, agency and state |
| FactPlan | Fact | Monthly premium plan and target loss ratio by product |
| DimDate | Dimension | Calendar with year, quarter and month |
| DimProduct | Dimension | Seven lines of business, personal and commercial |
| DimAgency | Dimension | Distribution partners with channel and tier |
| DimState | Dimension | States with region |
| DimCause | Dimension | Cause of loss with peril group |
| DimCustomer | Dimension | Customer segment, risk tier and tenure |
Policy effective and expiration dates and the claim report date are set up as inactive relationships and used inside the measures, which avoids ambiguous filter paths and keeps the model fast and predictable.
Measures that insurance teams actually use
| Measure | Meaning |
|---|---|
| Gross written premium | Premium written in the period, new business plus renewals |
| Earned premium | The part of written premium that applies to coverage already provided |
| Loss and LAE ratio | Incurred loss plus allocated expense, less recoveries, divided by earned premium |
| Expense ratio | Commissions plus operating expense divided by earned premium |
| Combined ratio | Loss ratio plus expense ratio; below 100% is an underwriting profit |
| Ex-cat loss ratio | Loss ratio excluding catastrophe-event claims |
| Claim frequency and severity | Claims per 100 policy-years, and incurred loss per claim |
| Retention rate | Expiring policy terms that renewed |
| Renewal rate change | Change in renewal premium compared with the prior term |
| Plan variance | Written premium against plan, and loss ratio against target |
Almost every headline card also has a prior-year comparison, calculated with the same measure on the same period one year earlier, with a colored change indicator so improvements and deteriorations stand out.
About the sample data
The report uses synthetic data for a fictional mid-sized US property and casualty carrier. It was built to show realistic patterns: rate increases, seasonal weather, named catastrophe events, rising litigation in commercial lines, channel mix shifts and agency differences. The figures are illustrative and not real company results.
Note: incurred but not reported claims are not modelled, so the most recent months look slightly light, as they would in a real book at the same valuation date.
Using it with your own data
- Open the project in Power BI Desktop, which is free to download.
- Replace each sample table query with your source: policy administration, claims, general ledger and planning.
- Keep the column names and the level of detail of each table, and the measures and visuals keep working.
- Refresh, check the ratios against a report you already trust, then publish.
Suggested levels of detail: policy term for policies, claim for claims, and month by product, agency and state for monthly premium.
Who it is for
- Insurance analysts and actuarial teams that need a ready reporting layer.
- Managing general agents, brokers and agencies that track partner performance.
- Power BI developers who build insurance reporting for clients and want a solid data model to start from.
- Students and career changers who want to see how insurance KPIs are modelled.
Frequently asked questions
Do I need a paid Power BI license?
You can open and explore the project in Power BI Desktop for free. Sharing reports in the Power BI service needs the licenses your organisation already uses for that.
Is the data real?
No. It is synthetic sample data that shows how the report behaves. You connect your own data to use it for real decisions.
Can I change the design or add pages?
Yes. It is a standard Power BI project, so you can change visuals, colors and pages, and add your own measures.
What if I need it adapted to my company?
Email contact@docynx.com and describe your data and the questions you need answered.
Get the Insurance Analytics Dashboard
The Power BI project, the data model and the sample data are available on Gumroad. Check the Gumroad page for the current price and the full list of what is included.
Get it on Gumroad → ✉ Ask a questionA note on interpretation: This dashboard is a reporting and learning tool. The sample figures are fictional. It is not actuarial, financial or regulatory advice, and any numbers you produce from your own data should be reviewed by qualified staff before they are used for decisions or filings.