US Housing Market at a Glance: Prices, Mortgage Rates and Affordability on One Page
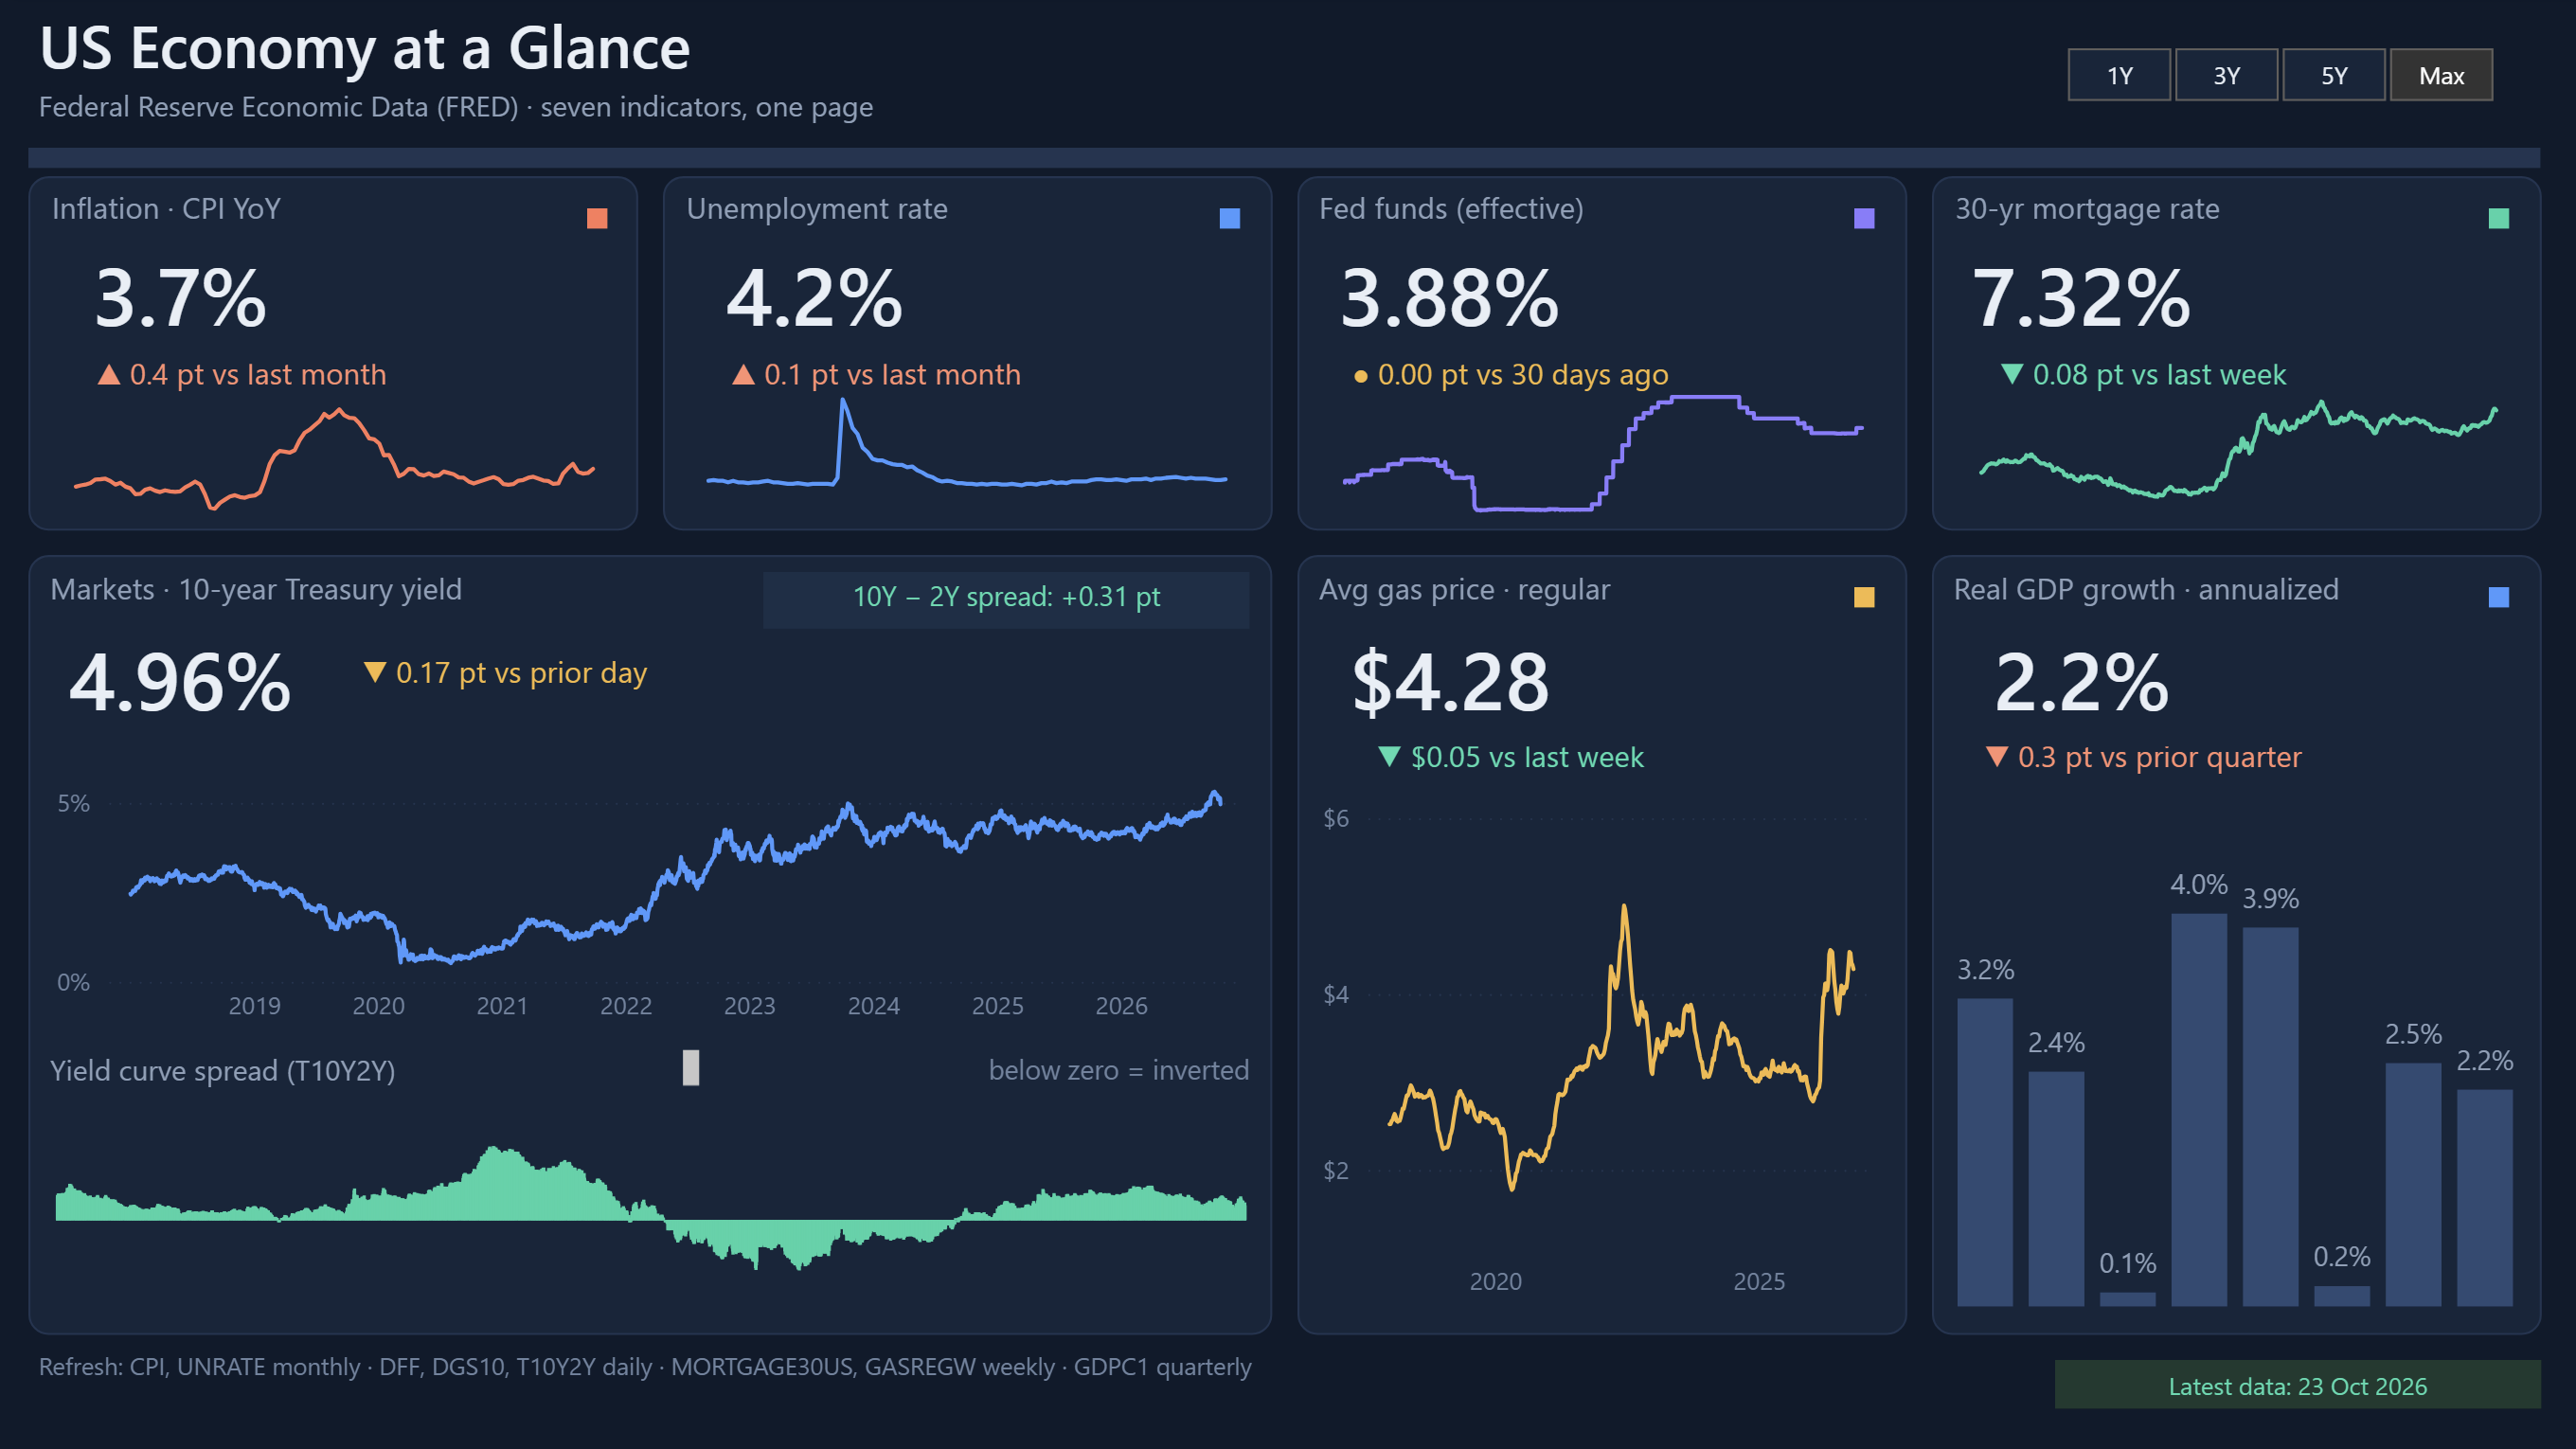
Home prices make the headlines, but what most buyers feel is the monthly payment. That payment depends on two things at once: the price of the home and the mortgage rate. This dashboard puts both side by side, along with construction, supply, rents and metro prices, so you can see why housing feels the way it does.
All the data comes from FRED, the Federal Reserve Economic Data service run by the Federal Reserve Bank of St. Louis. The dashboard is free to view here, and the Power BI file is free to download. You only need to send us an email.
What the dashboard shows
The page opens with six headline cards, a one-sentence insight that updates with the data, and then a set of charts that explain what sits behind the numbers.
The six headline cards
- Home price index: the national Case-Shiller index with its change from a year ago.
- 30-year mortgage rate: the latest weekly rate and how much it moved in a week.
- Monthly payment: the estimated payment on a median-priced home, compared with the 2021 average.
- Housing starts: new homes started, with the change from the previous month.
- New-home supply: how many months it would take to sell the current stock of new houses.
- Rent inflation: the year-over-year change in the rent index, with its month-over-month move.
The key insight line
Under the cards, one sentence compares the change in home prices with the change in the monthly payment since 2021. It is calculated from the data each time the report refreshes, so it never goes stale.
How to read the charts
Home prices vs mortgage rate
The large chart on the left plots the national price index against the 30-year mortgage rate. Watching them together shows how a jump in rates can lift the monthly payment even when prices barely move. It is the single best view for understanding affordability.
Affordability gauge
The gauge shows the estimated annual mortgage payment as a share of median household income. A common rule of thumb is that housing costs should stay near 30% of income, so the gauge marks 30% as its target. Next to it, two cards show the monthly payment and the median sales price that the estimate is built from.
How the payment is estimated: median sales price of houses sold, a 20% down payment, a 30-year fixed loan at the latest weekly mortgage rate, principal and interest only. It leaves out taxes, insurance and fees, so a real payment would be higher.
Starts vs permits
Housing starts count new homes where construction has begun. Permits are approvals to build. Permits usually move first, so a gap between the two lines can hint at where construction is heading.
Active listings and new-home supply
Active listings show how many homes are for sale. New-home supply measures how many months it would take to sell the new houses on the market at the current pace. Rising supply tends to cool prices, and tight supply tends to support them.
Rent vs buy
This chart sets both home prices and rents to 100 at the start of the selected range. If the price line climbs above the rent line, buying has become more expensive relative to renting over that period.
Metro snapshot
The table at the bottom compares Case-Shiller indexes for six large metros: New York, Chicago, Boston, Denver, Dallas and Tampa. It shows the latest index, the one-year change and the five-year change, so you can see which markets are heating up and which are cooling.
Use the time range selector
The buttons at the top switch every chart between 1Y, 5Y, 10Y and Max. Use 1Y for recent changes and Max to compare today with earlier housing cycles. The headline cards always show the latest values, whatever range you pick.
Where the data comes from and how often it updates
Each indicator is a FRED series with its own publishing schedule, so some cards change weekly and others only monthly or quarterly.
| Indicator | FRED series | Update frequency |
|---|---|---|
| Home price index (national) | CSUSHPINSA | Monthly |
| Median sales price | MSPUS | Quarterly |
| 30-year mortgage rate | MORTGAGE30US | Weekly |
| Housing starts | HOUST | Monthly |
| Building permits | PERMIT | Monthly |
| Active listings | ACTLISCOUUS | Monthly |
| New-home months of supply | MSACSR | Monthly |
| Rent index | CUSR0000SEHA | Monthly |
| Median household income | MEHOINUSA646N | Annual |
| Metro price indexes | NYXRSA, CHXRSA, BOXRSA, DNXRSA, DAXRSA, TPXRSA | Monthly |
Because income is published once a year, the affordability gauge uses the latest income figure available and can lag behind today's prices and rates.
Download the PBIX file for free
The dashboard file is not a premium feature. To get it, send an email to contact@docynx.com and we will send you the .pbix file. You can open it in the free Power BI Desktop, change the layout, add your own indicators or use it as a learning project.
About the FRED API key
The dashboard refreshes by calling the FRED API, which needs an API key. You have two options:
- Use the key already in the file. The PBIX comes with a working key, so it refreshes as soon as you open it. Because many people may share it, it can run into FRED's rate limits.
- Use your own key. FRED API keys are free. Create an account on the FRED website, request a key, and replace the value of the
ApiKeyparameter in Power Query. Your own key gives you your own usage limit.
Either way, the data comes straight from FRED, so no manual downloads are needed.
A note on interpretation: This dashboard is for learning and general information. It is not financial, mortgage or investment advice. The payment figure is a simplified estimate, and economic data is often revised after it is first published, so values may change slightly after the dashboard refreshes.
Conclusion
Housing affordability comes from the interaction of prices, rates, income and supply. Putting those pieces on one page makes the story easier to see: a market can look steady on price and still become much harder to afford once the mortgage rate moves. If you build your own version, start with the FRED series above and add the indicators that matter to your market.