Energy and Gas Prices Tracker Dashboard for Power BI: Oil, Gasoline, Natural Gas and Renewables
What are you paying for energy, and is it going up or down? Crude oil, gasoline, diesel, natural gas and electricity are reported by different sources at different speeds, some daily, some weekly and some monthly, which makes them hard to compare.
This one-page dashboard puts them side by side. It shows the latest price and the change from a year ago for six energy prices, how much of the pump price is the cost of crude oil, and a renewable energy section that shows which countries get the most electricity from renewables. The data is read live from the FRED API and World Bank Open Data.
What is inside
1. Price tiles and key insight
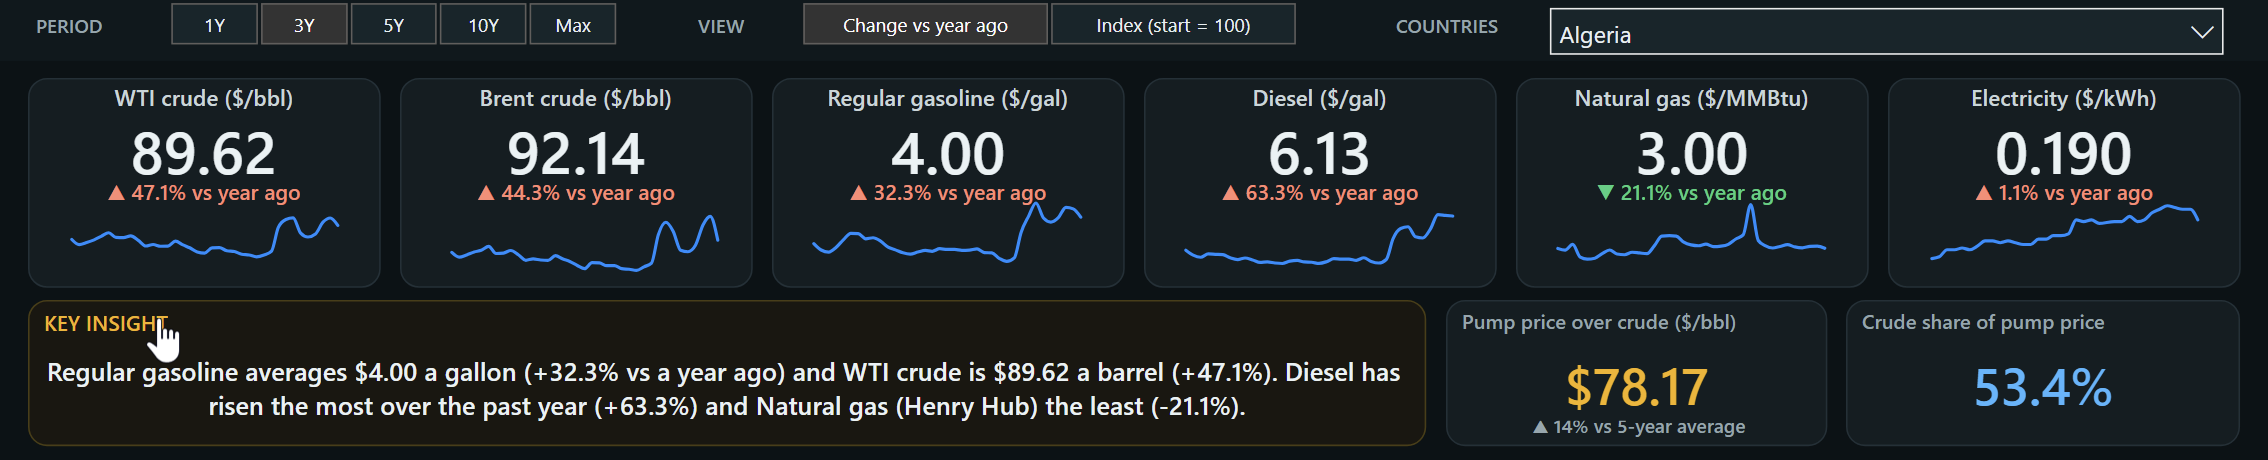
Six tiles across the top show the latest reading for WTI crude, Brent crude, regular gasoline, diesel, natural gas and residential electricity. Each tile shows the change from a year ago with an arrow, in a warm colour when the price is up and green when it is down, and a small trend line. Under the tiles, a key insight sentence rewrites itself from the data: it states the current gasoline and crude prices and names the price that rose the most and the least over the past year. Two cards show the pump price over crude and the crude share of the pump price.
2. Trends and the price monitor
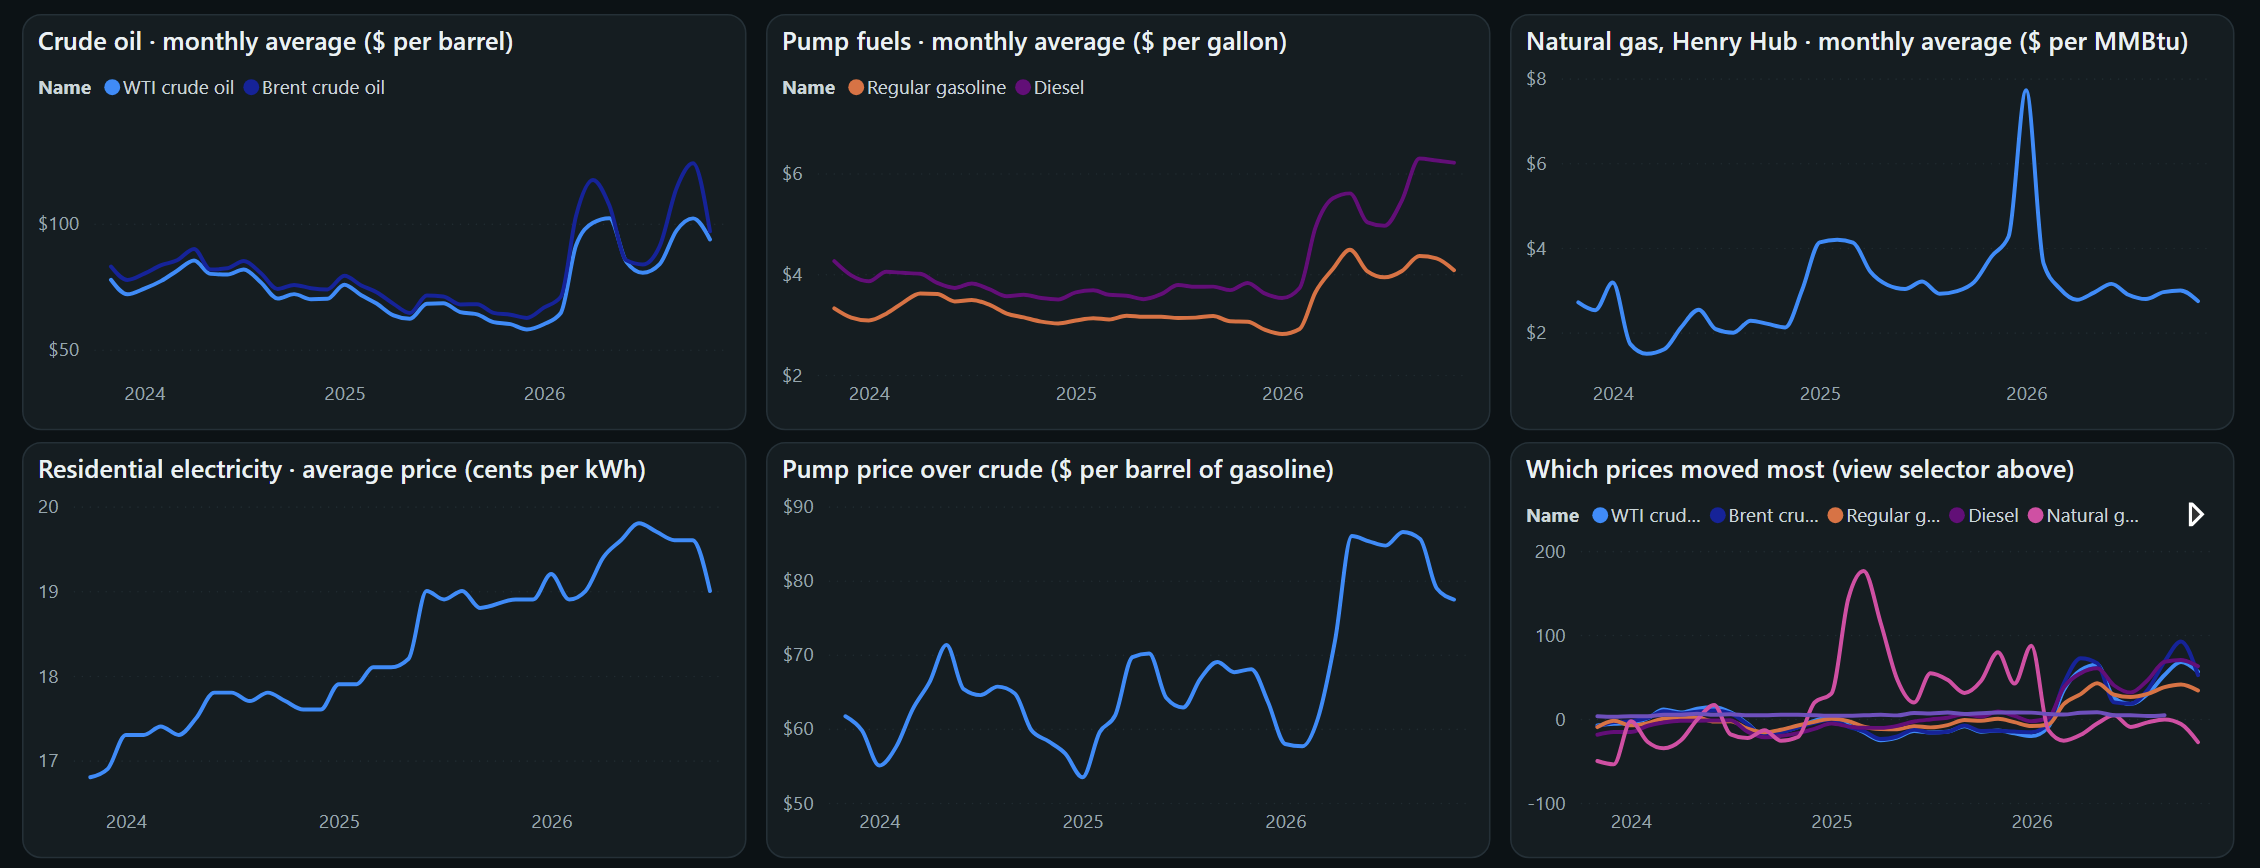
Six charts show monthly average prices for crude oil, pump fuels, natural gas and residential electricity, the gap between the pump price and crude, and a comparison of which prices moved the most. A period selector switches between 1, 3, 5 and 10 years or the full history, and a view selector switches between change from a year ago and an index that starts at 100. At the bottom, a price monitor table lists every series with its latest reading, year-over-year change, one-year high and low and five-year average.
3. Renewable energy: who is switching?
A second section uses World Bank data. Three cards show the US renewable share of electricity, the world share and the number of countries that get more than half of their electricity from renewables. A line chart follows the countries you pick, a bar chart ranks the 12 largest economies, and a bubble chart compares each country's renewable share of electricity with its share of total energy, with bubble size showing the size of its economy.
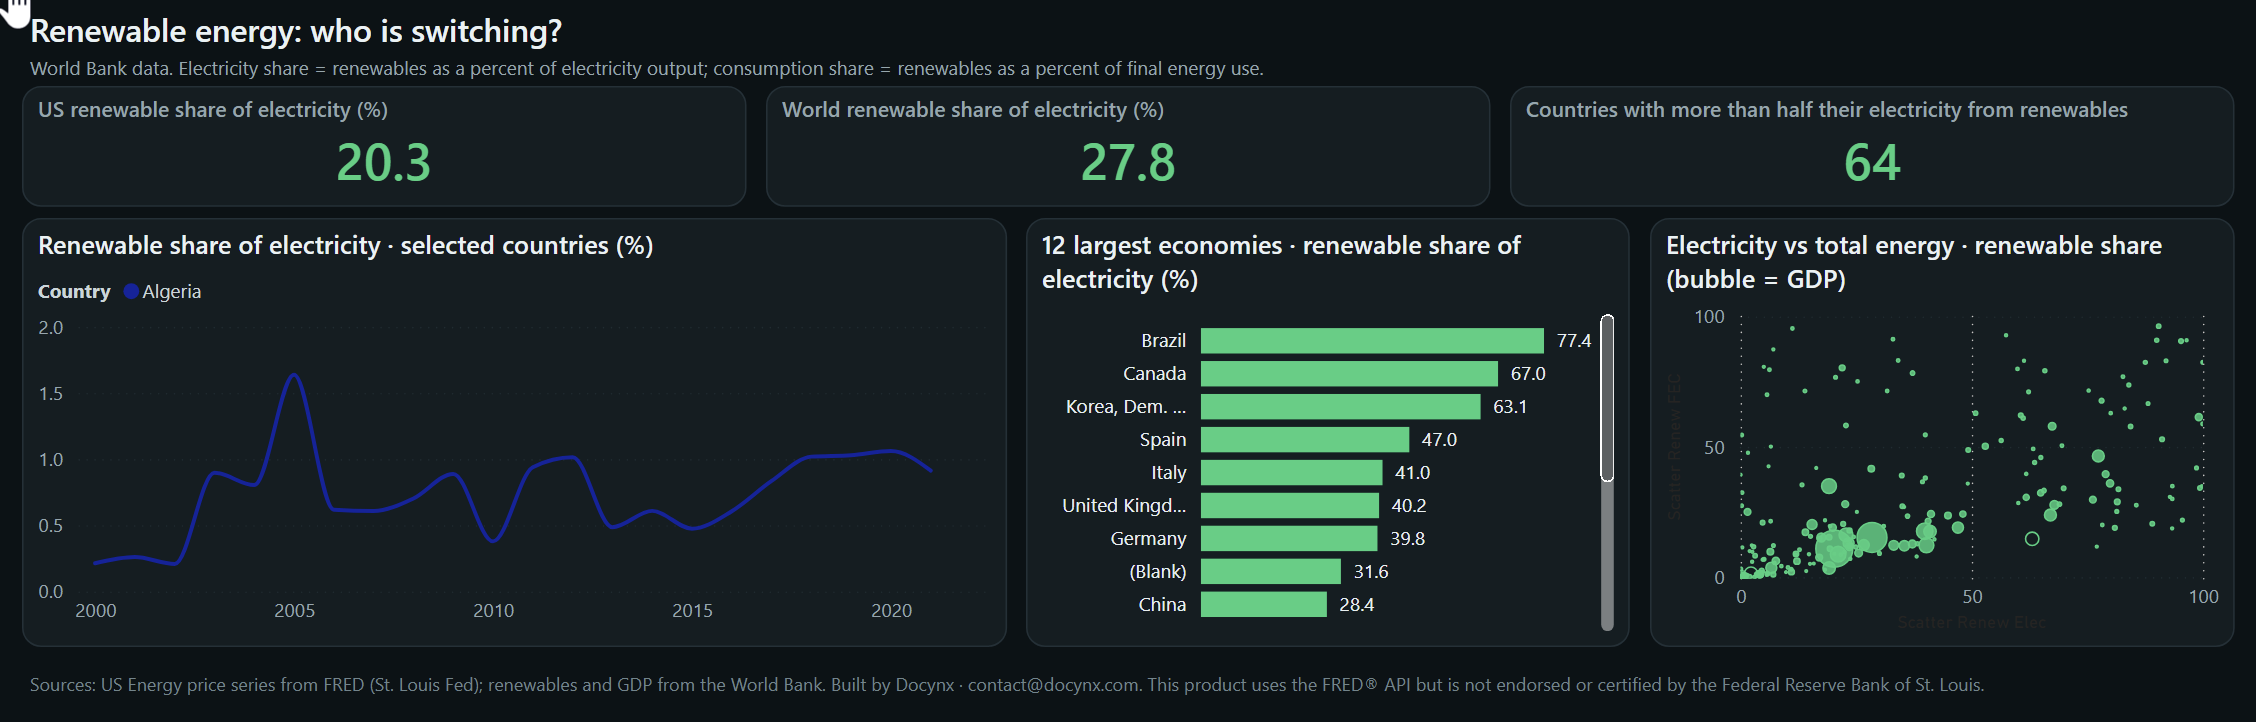
Three selectors at the top control the page: the time period, the view (change from a year ago or an index) and the countries used in the renewable trend chart. Choose up to eight countries to draw the trend lines.
Where the data comes from
US energy prices come from the FRED API of the Federal Reserve Bank of St. Louis. The series are WTI and Brent crude oil (daily), regular gasoline and diesel retail prices (weekly), Henry Hub natural gas (daily) and the average residential electricity price (monthly). They originate with the U.S. Energy Information Administration and the Bureau of Labor Statistics, and the history starts in 2010.
Renewable energy and GDP data come from World Bank Open Data, from 2000 onwards, with each country grouped by region and income group. Because the sources update at different speeds, gasoline and diesel change weekly, electricity monthly and the renewable statistics once a year, so the latest renewable year is usually behind the price data. The page shows the date of the latest price reading.
How the data model is organised
The report sits on a small model with two data tables, two matching lookup tables and two selector tables that drive the period and view choices.
| Table | Type | What it holds |
|---|---|---|
| Energy | Fact | One row per date per price series: the date, the value, the series and the month it belongs to |
| EnergySeries | Dimension | The six price series with their name, group (oil, pump fuels, natural gas, electricity), unit, update frequency and display order |
| Renewables | Fact | One row per country per year for three World Bank indicators: renewable share of electricity, renewable share of final energy use and GDP |
| DimCountry | Dimension | Countries and regional totals with region and income group, plus a flag that separates real countries from totals such as the world |
| Range and ViewMode | Selector tables | Hold the choices behind the period selector and the view selector |
Measures you can use
| Measure | Meaning |
|---|---|
| Latest value | The most recent reading of each price series |
| Year-over-year change | Latest reading compared with the reading a year earlier |
| One-year high and low | Highest and lowest reading over the last twelve months |
| Five-year average | Average reading over the last five years, and how far the latest reading is above or below it |
| Pump price over crude | Regular gasoline price times 42 gallons, minus the WTI crude price per barrel |
| Crude share of pump price | The crude cost per gallon (WTI price divided by 42) as a share of the gasoline price |
| Index (start = 100) | Monthly average price relative to the first month of the selected period, which equals 100 |
| Renewable share of electricity | Renewables as a percentage of electricity output, for the latest year available |
| Largest economies | Ranks countries by GDP so the bar chart can show the 12 largest |
| Countries above 50 percent | Number of countries that get more than half of their electricity from renewables |
The tiles always show the latest reading, while the charts use monthly averages so that daily, weekly and monthly series can be compared on the same axis.
How to read the numbers
- Colours show direction, not good or bad: a warm arrow means the price is higher than a year ago and a green arrow means it is lower.
- Pump price over crude: a barrel holds 42 gallons, so gasoline price times 42 minus the crude price shows what is added between the oil well and the pump. That covers refining, distribution, marketing and taxes, not only refining margins.
- Natural gas is a wholesale price: Henry Hub is the benchmark price paid between traders, not what a household pays on a bill.
- Different update speeds: crude oil and natural gas are daily, gasoline and diesel weekly, electricity monthly and renewable energy yearly.
- Regional totals: the world figure is a World Bank aggregate and is kept separate from individual countries in the charts.
Who it is for
- Drivers and households who want to follow fuel and electricity prices in one place.
- Students and journalists who need clear charts of energy price trends.
- Transport, logistics and small business owners who watch fuel costs.
- Power BI developers who want an example of combining two public APIs in one model.
Related dashboards
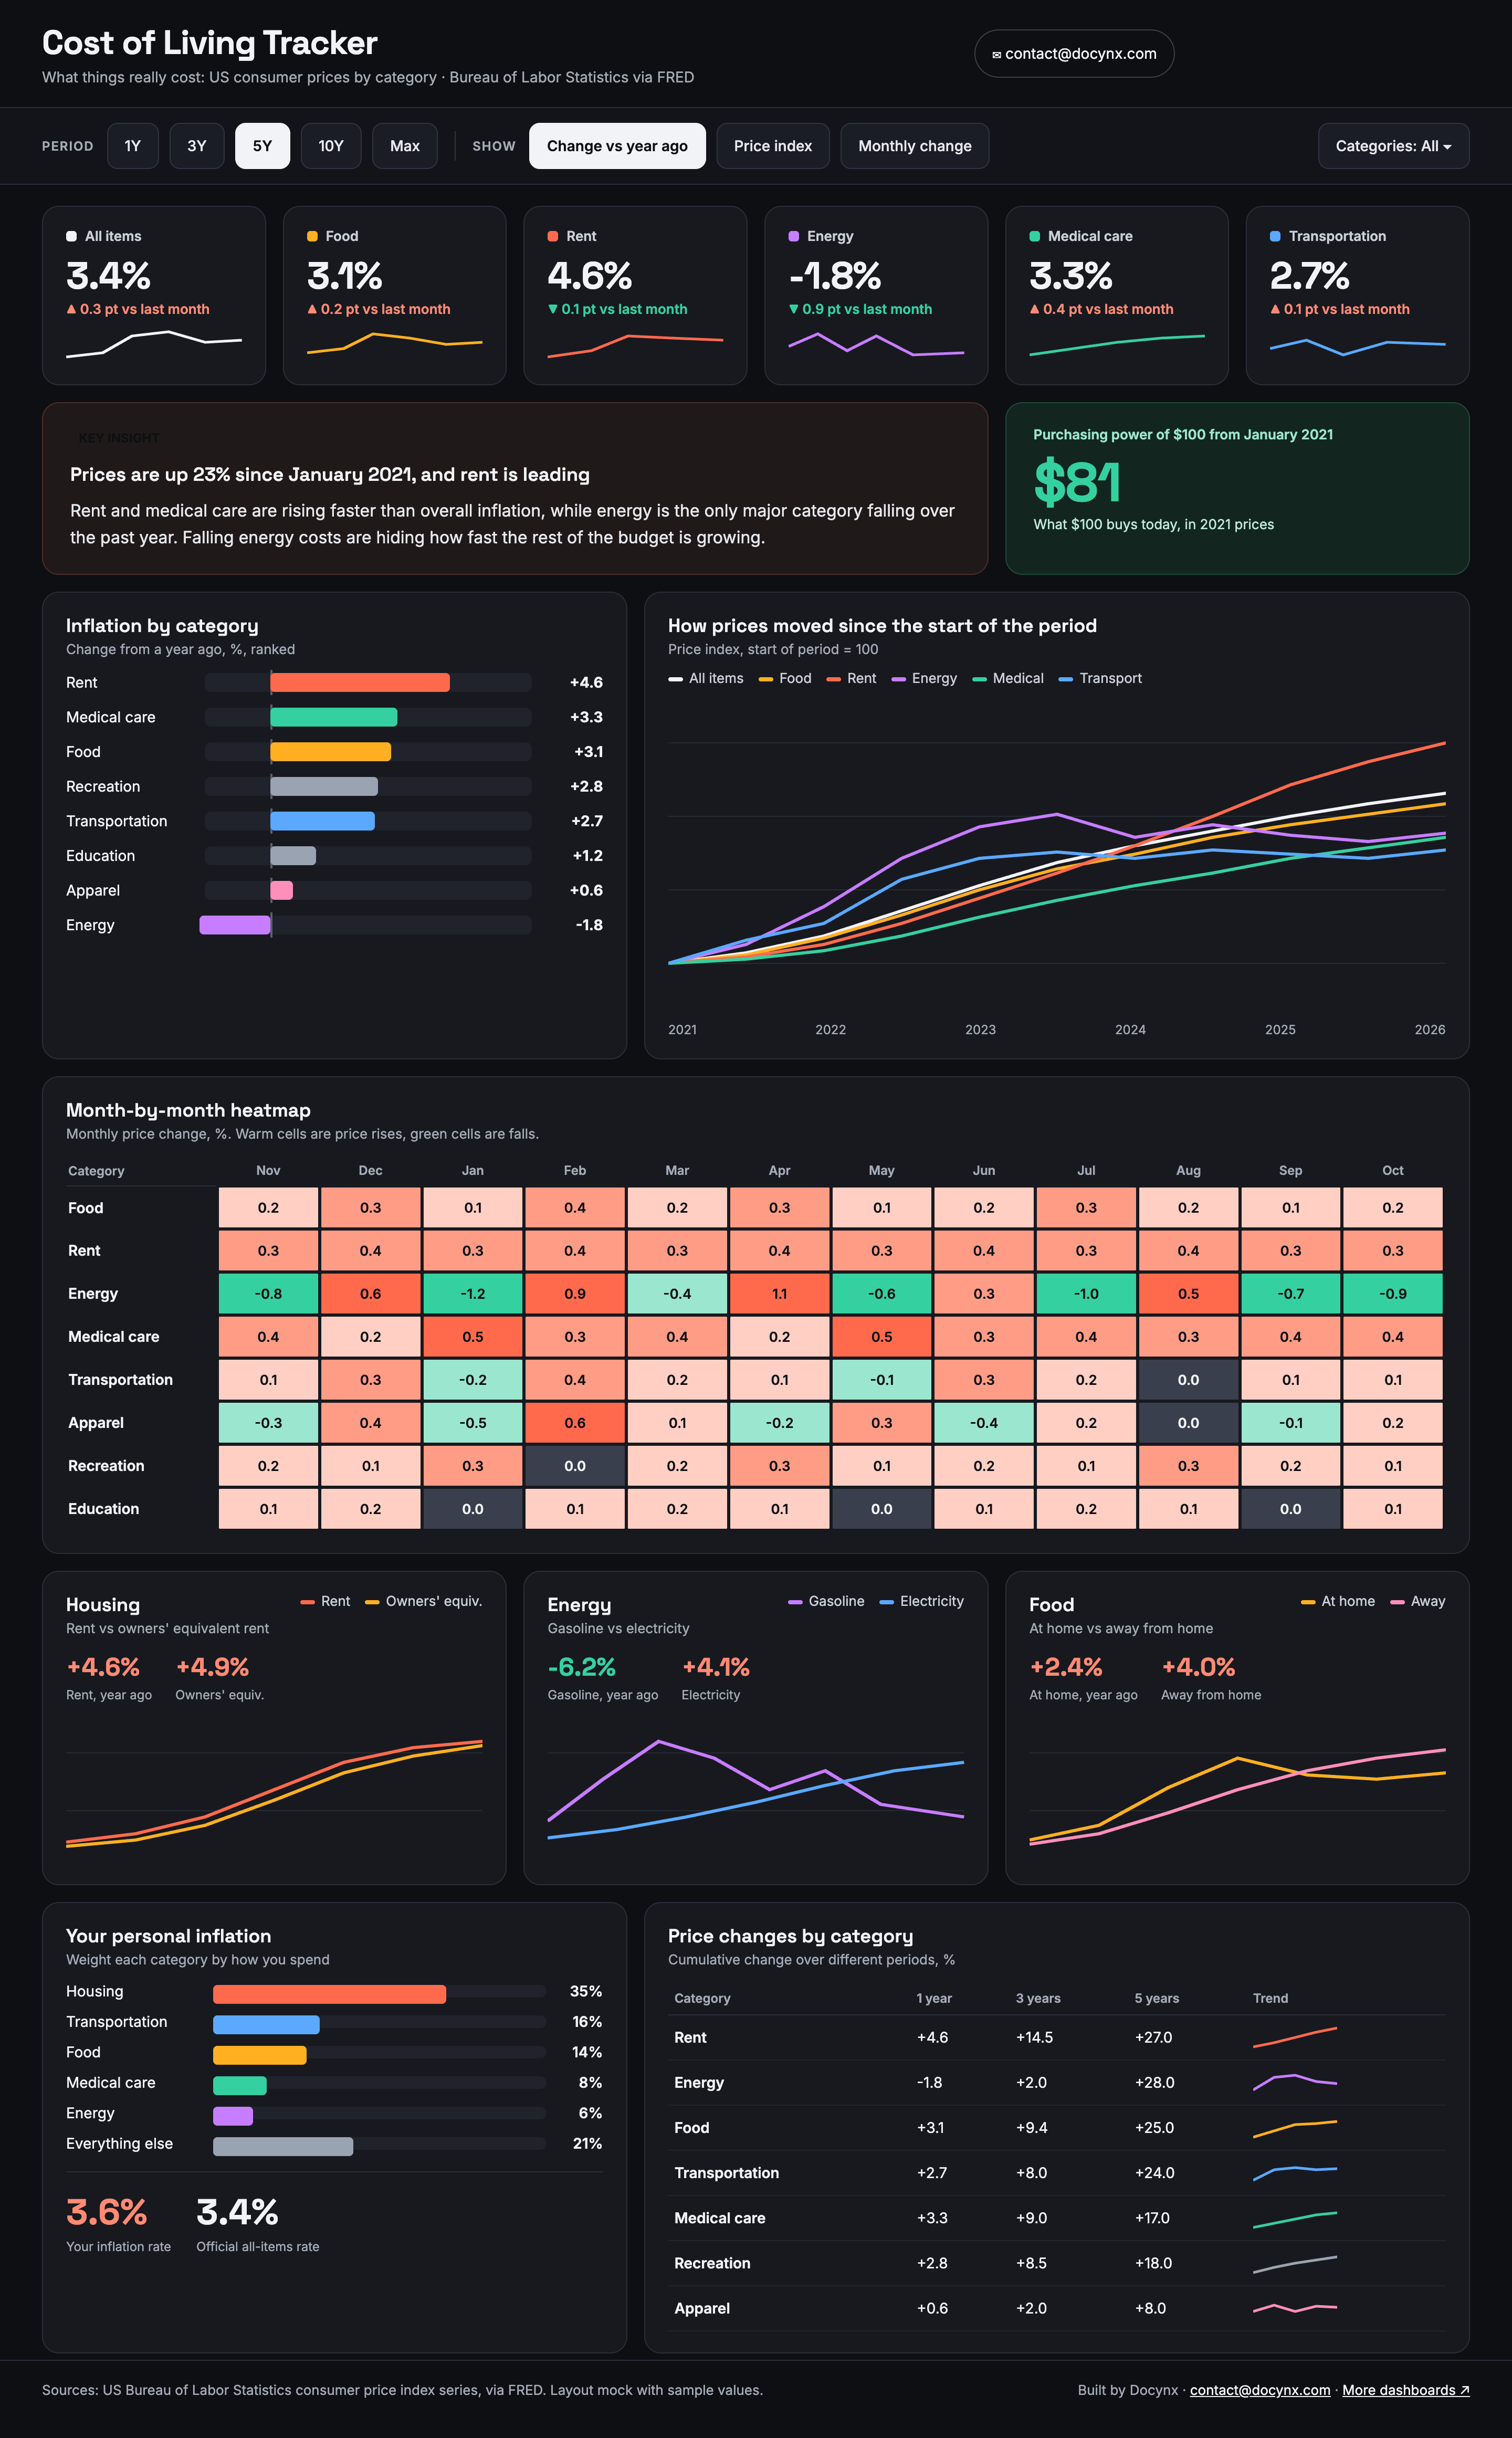
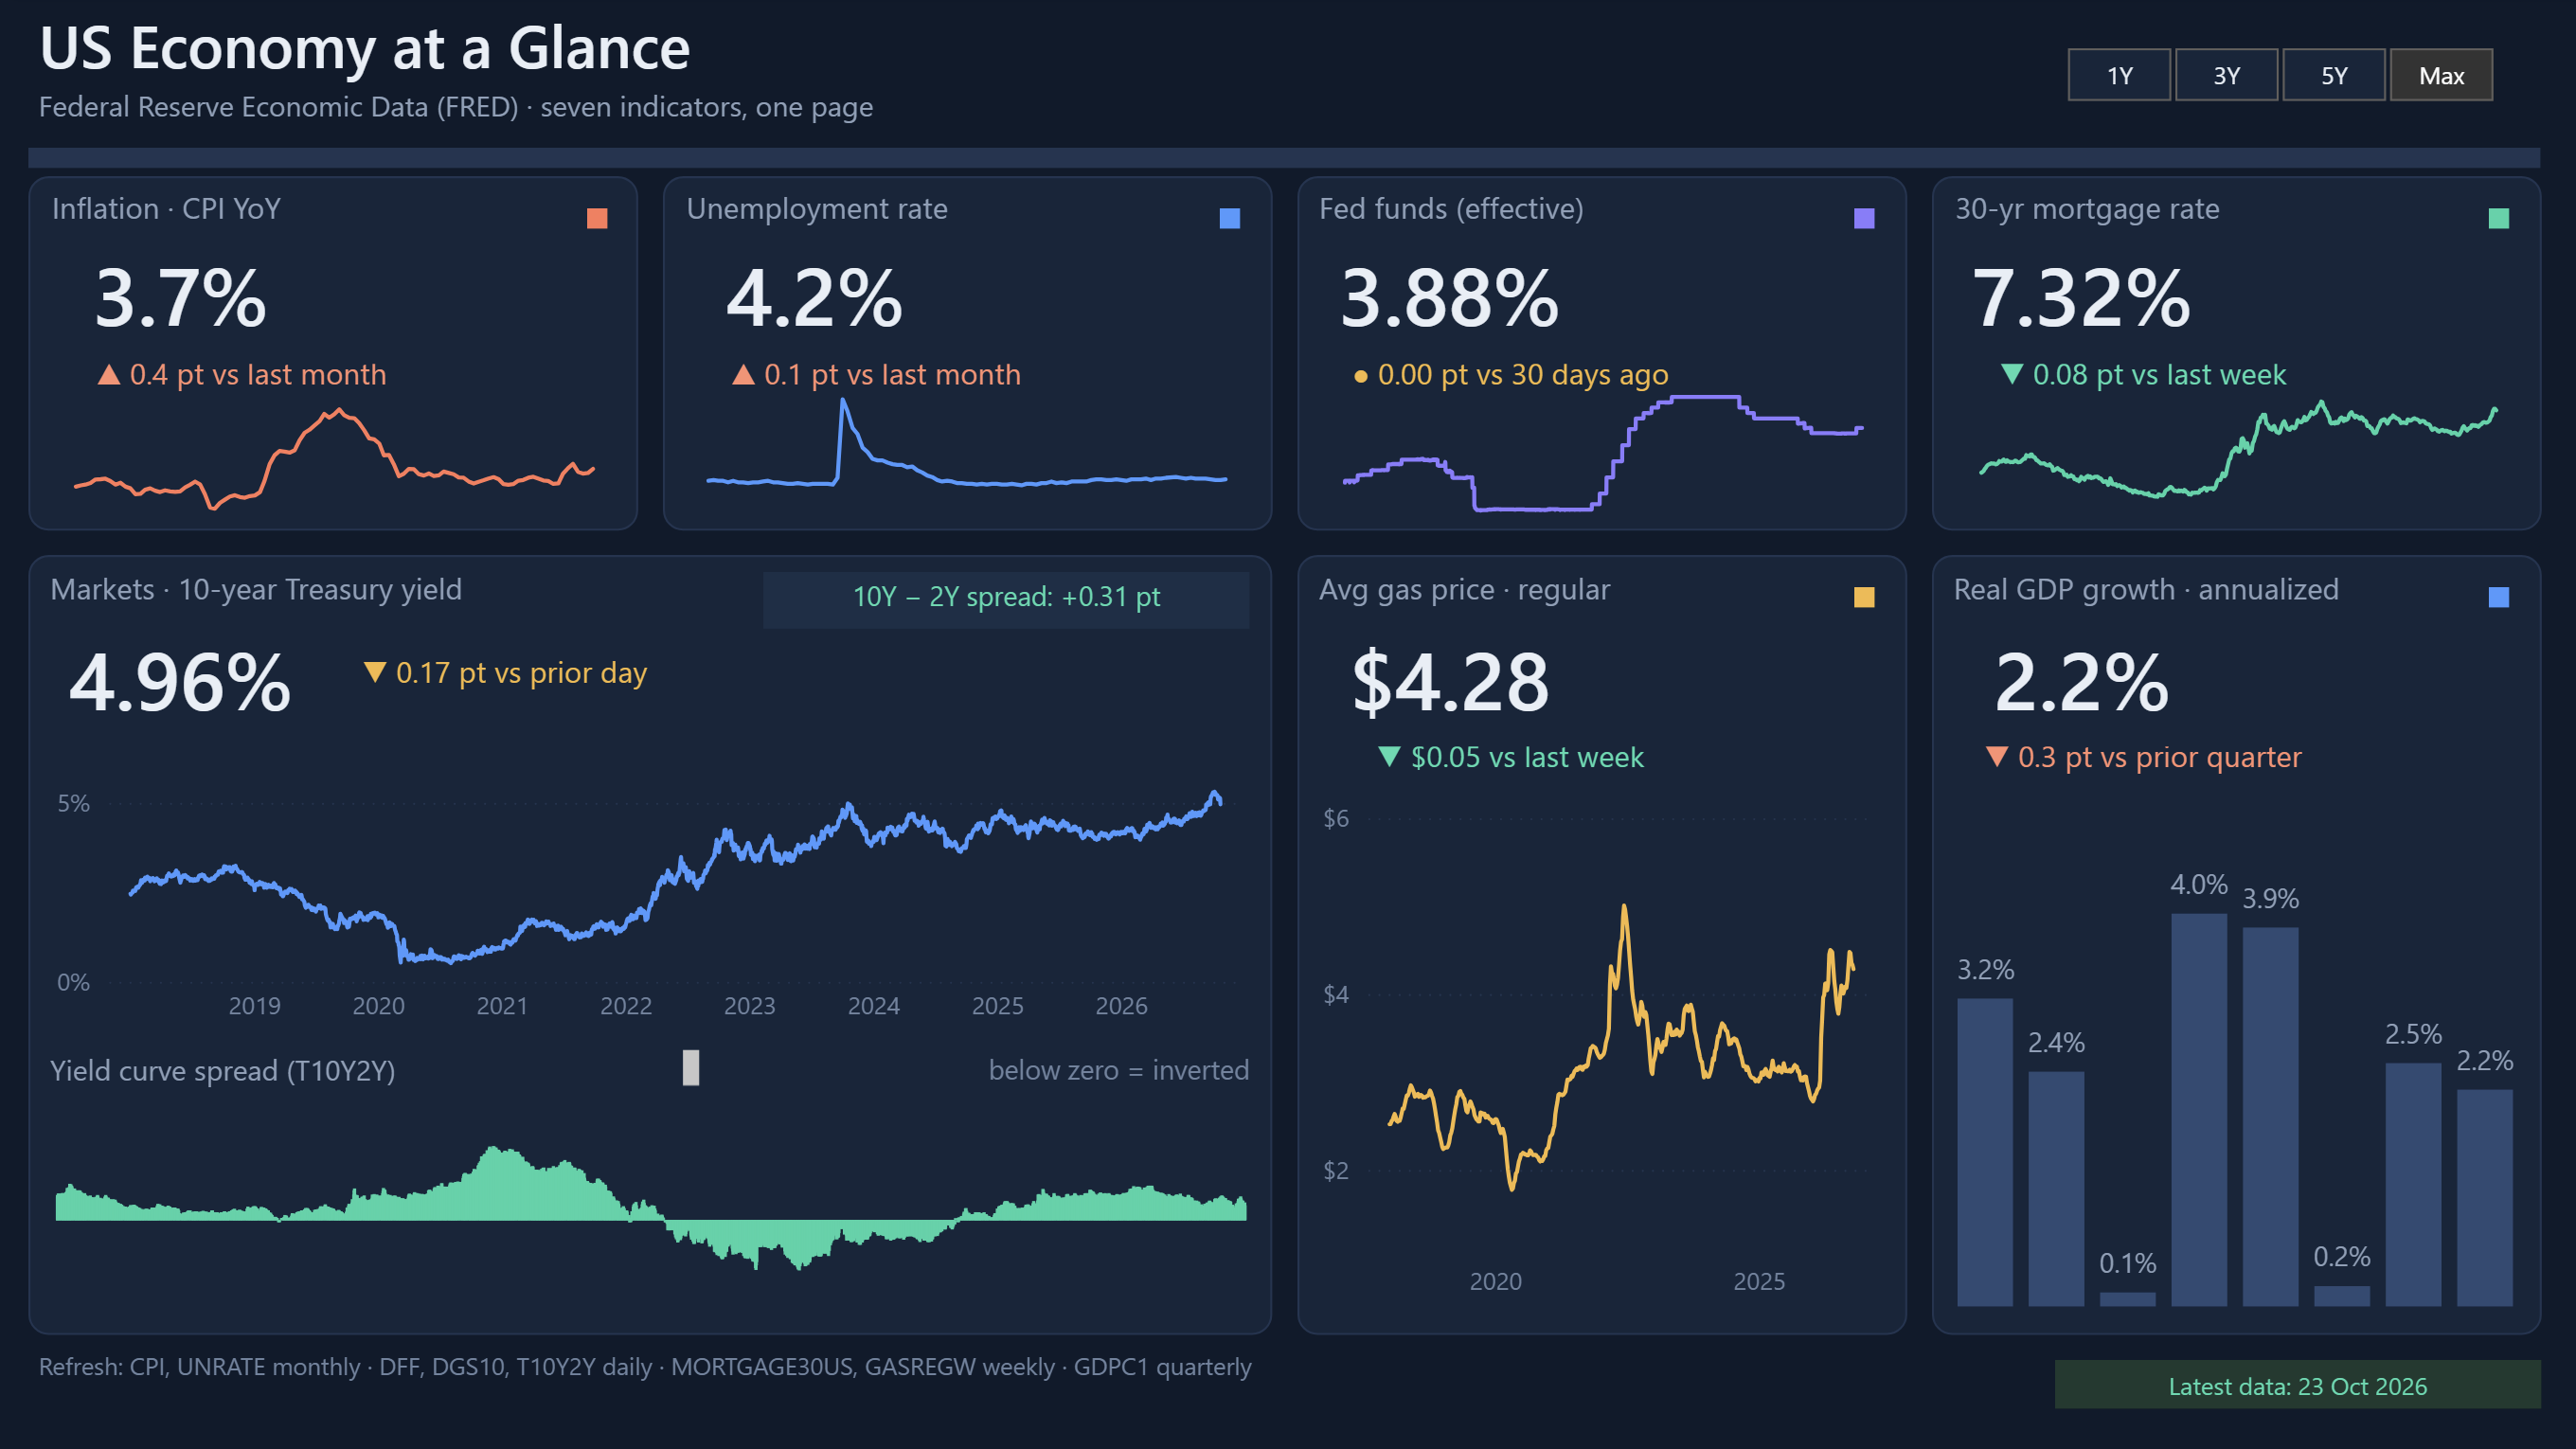
- US Economy at a Glance: gas prices next to inflation, unemployment and interest rates.
- Cost of Living Tracker: how the energy part of inflation compares with food, rent and medical care.
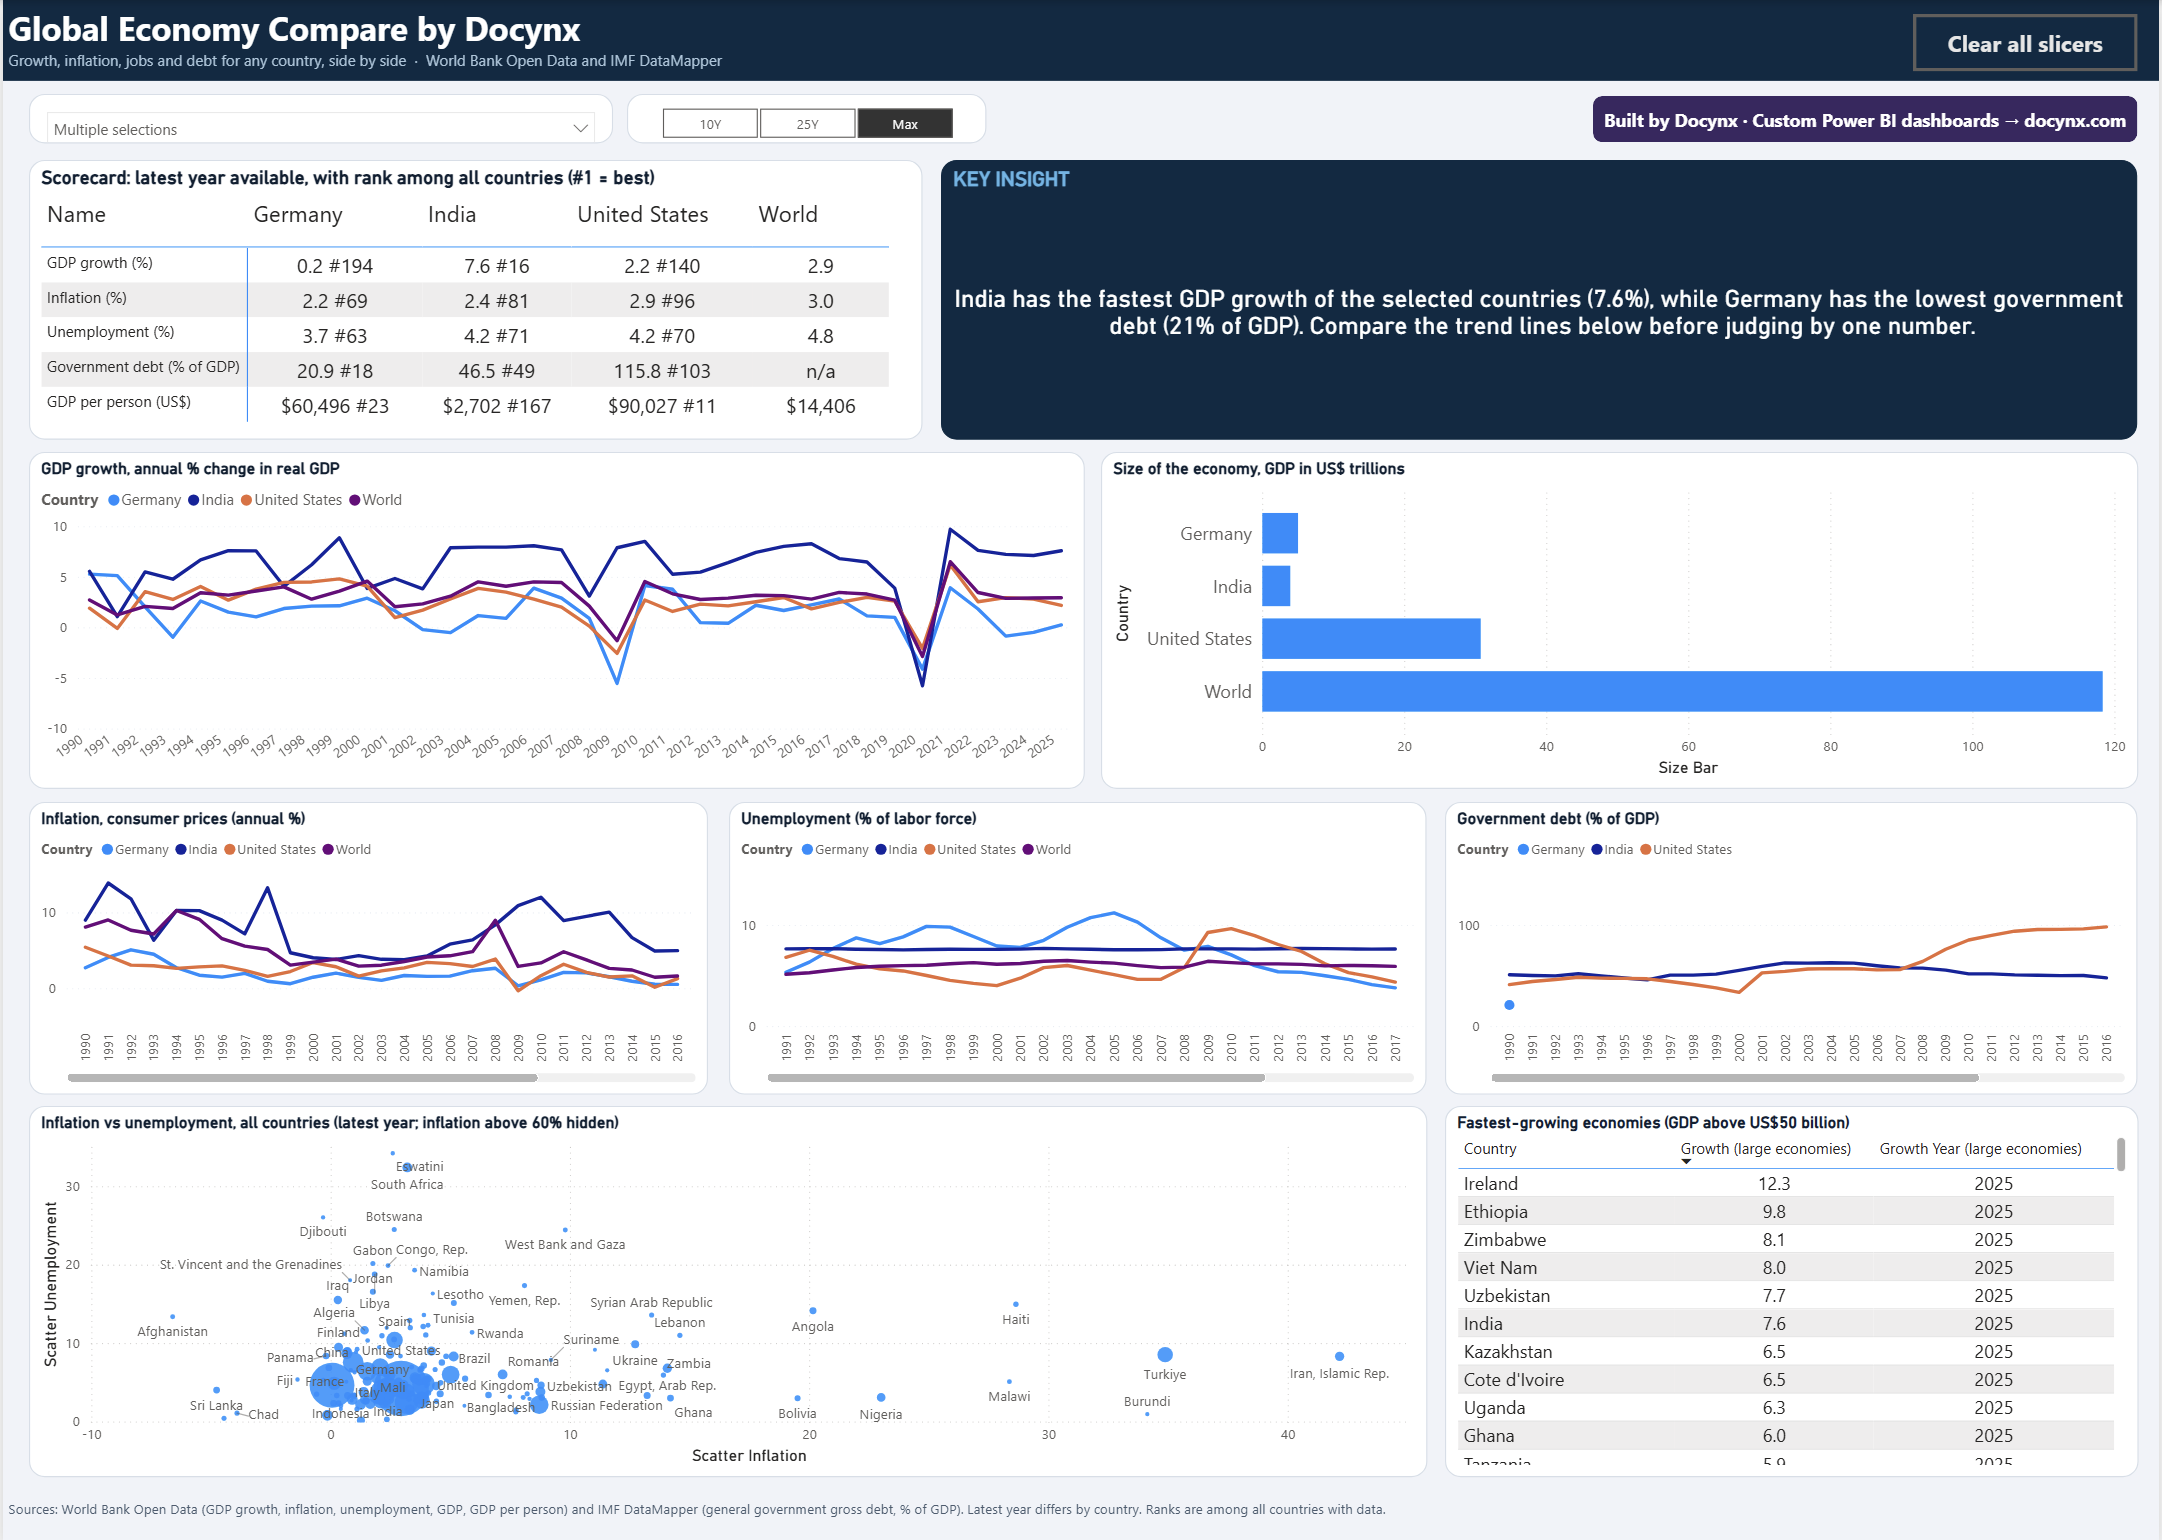
- Global Economy Compare: compare countries on GDP, inflation and debt, using the same World Bank source.
- Solar Energy Analytics Dashboard: plant-level solar performance, a good next step after the renewables section here.
Frequently asked questions
Where does the data come from?
US energy prices come from the FRED API of the Federal Reserve Bank of St. Louis, and renewable energy and GDP figures come from World Bank Open Data.
How often is it updated?
Crude oil and natural gas prices are daily, gasoline and diesel weekly, electricity monthly and renewable energy yearly, so the dashboard is refreshed regularly and each tile shows its own latest date.
What is the pump price over crude?
It is the gasoline price for a full barrel of 42 gallons minus the price of a barrel of WTI crude. It shows how much is added by refining, distribution, marketing and taxes.
What do the arrows and colours on the tiles mean?
An arrow up in a warm colour means the price is higher than a year ago, and an arrow down in green means it is lower.
Is the dashboard free to use?
Yes. You can explore it on this page without signing up.
Questions or ideas for this dashboard?
Tell us which fuels, regions or indicators you would like to see added.
✉ Ask a questionData notice: This product uses the FRED® API but is not endorsed or certified by the Federal Reserve Bank of St. Louis. Renewable energy and GDP data come from World Bank Open Data, licensed under CC BY 4.0.
A note on interpretation: This dashboard is a reporting and learning tool built on public data. It is not financial, investment, legal or policy advice, and any figures you rely on for decisions should be checked against the original source.